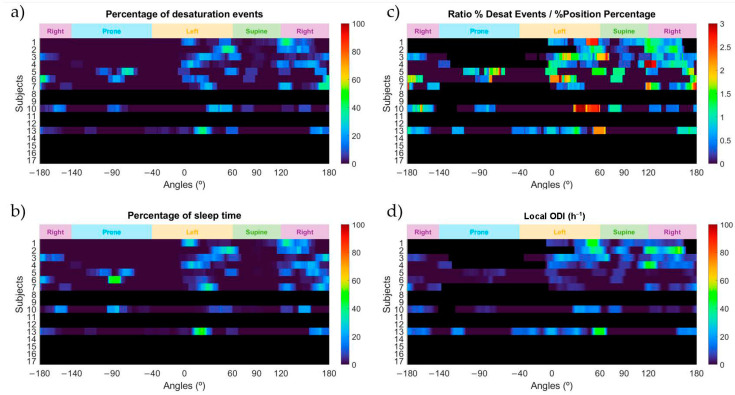
Figure 6.
Heatmaps of the percentage of desaturation events (a); the percentage of sleep position time (b); the ratio between the percentage of desaturation events and the percentage of sleep position time (c); and the local ODI (d) for each sleep position angle and for the subjects who underwent positional treatment. Black colors shown in the heatmap indicate that either the subject was not treated with the ‘SleepPos’ app positional treatment or the ratio and the local ODI could not be calculated for that specific angle due to no time slept on it.

