Figure 6.
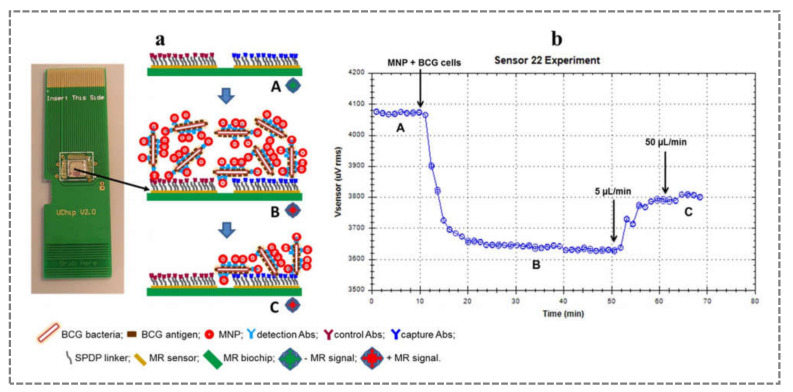
Image of an MR-biochip with the scheme of the sandwich-immunoassay reactions (a), and the corresponding average voltage variation curves over time, in the right area of the sensors whose surface was functionalised with capture antibodies (b): step A is the baseline or the negative MR signal (no label); then, the voltage drop is observed in step B due to positive MR signal (MNP@Abs@BCG in contact with the MR-biochip surface); and in step C, the non-bounded MNP are washed out and only the positive MR signal from labelled targets is recorded (MNP@Abs@BCG bonded to specific Abs on the biochip surface) (reproduced with permission from Barroso et al. (2018) [72], Copyright 2018, Elsevier B.V.).

