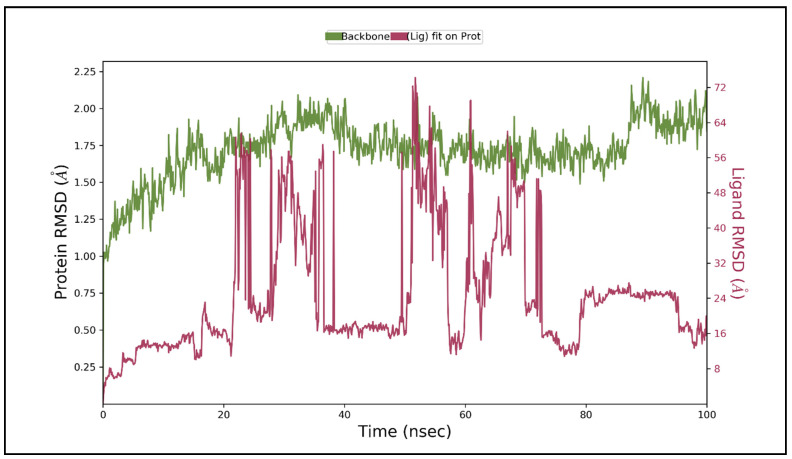
Figure 9.
Root means square deviation (RMSD) of protein and ligand after the initial RMSD values were stabilized. This plot shows RMSD values for protein on the left Y-axis, whereas for ligand, these values are indicated on the right Y-axis. The RMSD graph for the backbone is shown in green, and for theligand fit on protein in red.

