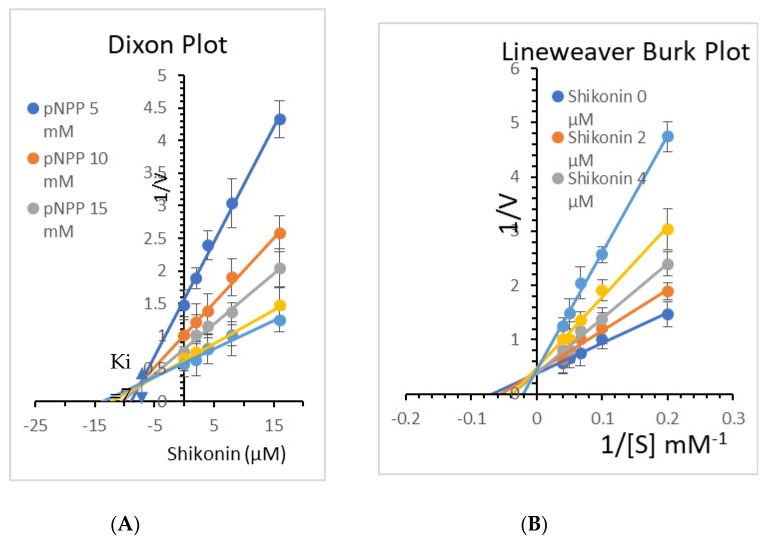
Figure 13.
(A) Dixon plots of protein tyrosine phosphatases 1B (PTP1B) inhibition by Shikonin at various substrate (pNPP) concentrations (5, 10, 15, 20, and 25 mM). (B) Lineweaver–Burk plot for inhibition of PTP1B by Shikonin was analyzed in the presence of different concentrations of Shikonin (0, 2, 4, 8, and 16 µM).

