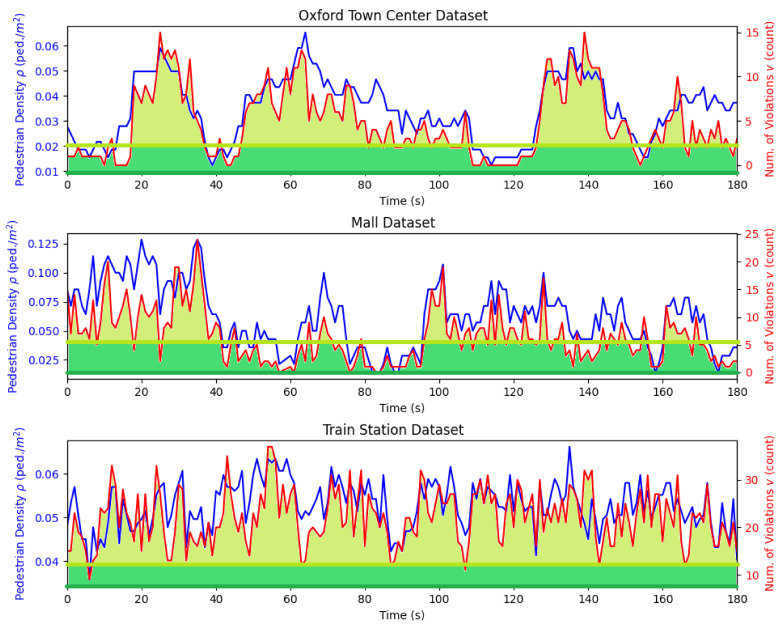
Figure 4.
The change of pedestrian density and the number of violations v over time. It shows an obvious positive correlation between and v. The positive correlation is further illustrated in Figure 5 and Figure 6, which show a linear relationship between and v. The darker green horizontal line indicates the critical pedestrian density and the lighter green line, the intercept density . They are obtained by the proposed critical social density estimation methodology in Section 4.5. The shaded lighter green area shows that there will be more violations if the pedestrian density is above . The shaded darker green area shows that more violations will be eliminated if the pedestrian density is further pushed below , which is our critical social density.

