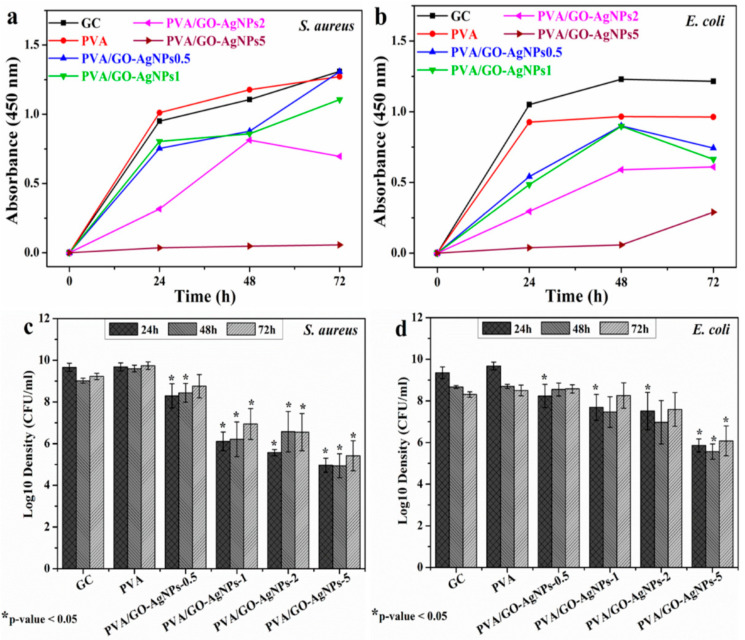
Figure 2.
Absorbance vs. time curves for S. aureus (a) and E. coli (b) after exposure to PVA/GO-AgNPs composite films. Viable counts of S. aureus (c) and E. coli (d). Samples are labelled as PVA/GO-AgNPsx, where x denotes the wt% of the Go-AgNPs filler. Reprinted with permission from ref. [49]. Copyright 2021 MDPI.

