POLITICAL SCIENCES Correction for “Militarization fails to enhance police safety or reduce crime but may harm police reputation,” by Jonathan Mummolo, which was first published August 20, 2018; 10.1073/pnas.1805161115 (Proc. Natl. Acad. Sci. U.S.A. 115, 9181–9186).
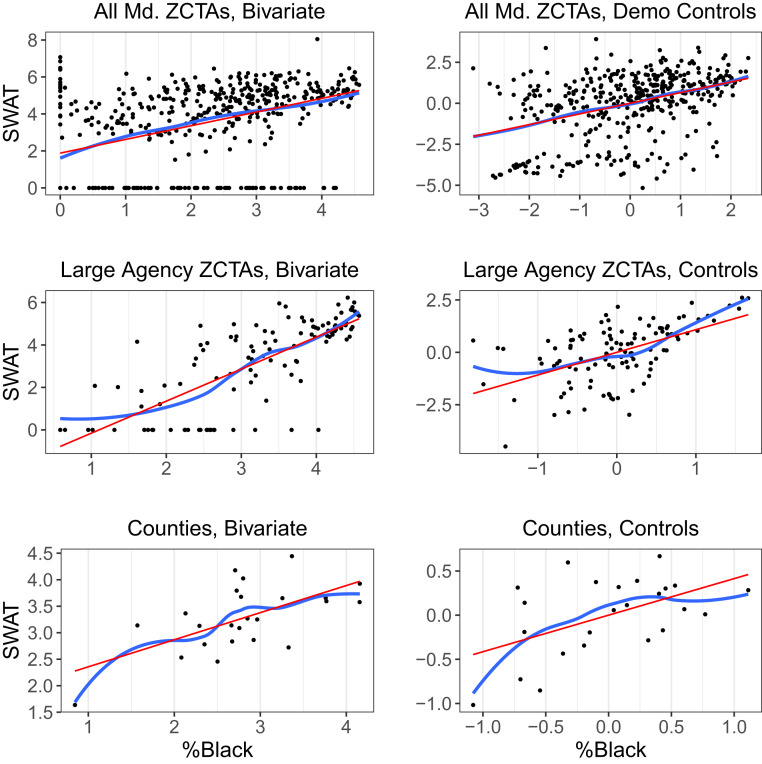
The authors note that: “This correction addresses recently discovered code errors that affect one section of this paper’s analysis. Fortunately, after correcting these errors, reported results are not substantively altered. All corrected results also remain statistically significant (P < 0.05). Fig. 1 analyzes predictors of SWAT team deployments in Maryland. A recent code review showed crime data for one of the three jurisdictions was incorrectly merged. This affects two reported results. The first is displayed graphically in Fig. 1 (Middle row, Right panel), a zip-code (ZCTA)-level analysis that adjusts for covariates including local crime rates (corresponding numeric results in SI Appendix Table S8, column 4). The originally published coefficient on racial composition, discussed in the main text, was 1.05, and the revised coefficient after fixing the merge error is 1.08. The predicted increase in SWAT deployments for a 10% increase in %Black, also discussed in the main text, changes from 10.53% to 10.85% after the correction. The second affected result appeared in SI Appendix Table S9, column 4, which is the same analysis with population weights added. Here, the coefficient of interest remained 0.85, but the standard error changed from 0.19 to 0.18. In addition, the weights were incorrectly specified in the model corresponding to SI Appendix Table S9, column 1. Correcting this error changes the previously reported coefficient on %Black from 0.74 (SE = 0.07) to 0.60 (SE = 0.05).” The corrected Fig. 1 appears below. The SI Appendix has been updated online to show the corrected Tables S8 and S9.
Fig. 1.
SWAT deployments are more frequent in areas with high concentrations of African Americans. (Top row) Maryland ZCTAs. (Middle row) ZCTAs from three large Maryland agencies. (Bottom row) Maryland counties. Left column shows bivariate relationships. Right column controls for social indicators in corresponding geographic unit. Locally weighted and linear regression fits are shown. Variables are plotted on log scales.


