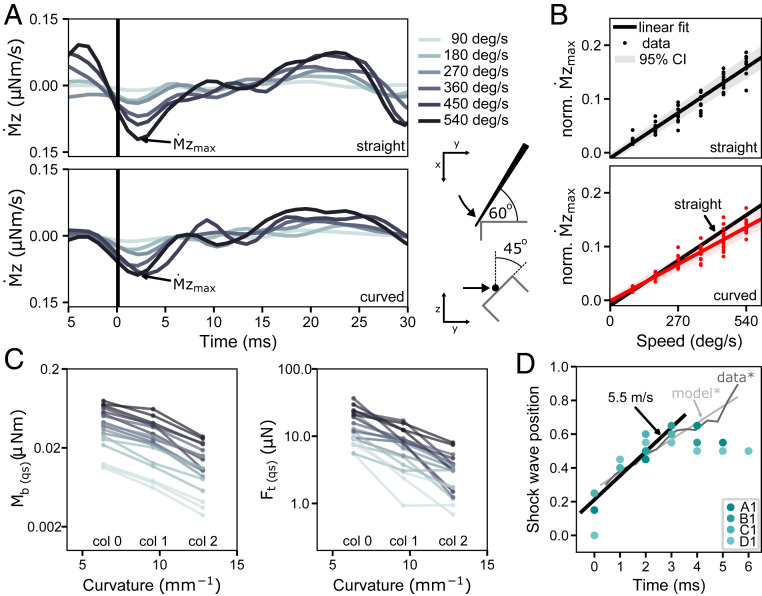
Fig. 2.
Deformation waves resulting from collisions of straight and curved whiskers against a straight edge. (A) Mechanical response of a straight and curved whisker in response to a collision. The derivative of the moment at the base of the α-whisker is shown for six different whisker speeds (90, 180, 270, 360, 450, and 540 deg/s; color coded). Trials are aligned at the time of impact (black line). (Bottom, Right) Illustration of the top and side view of the corresponding experiment is given. (B) Relationship between normalized amplitude of the shock and whisker velocity for 12 straight and 12 curved whiskers (α, A1, A2, B1, β, B1, B2, γ, C1, C2, δ, D1, and D2). The linear fit is represented by a black solid line (95% CI shaded in gray). Note that the slope of the two regression lines is significantly different between straight and curved whiskers. (C) Bending moment and transverse force Ft at time of the shock in respect to curvature of the whisker. Note that and are averaged values of the first 30 ms after collision, representing quasistatic (qs) measures. The slope of the linear regression curve is significant for (r2 = 0.307, P < 0.001) as well as (r2 = 0.467, P < 0.001). (D) Position of maximum deformation normalized to whisker length for whiskers A to D of the first column in the array. A linear fit to the first 4 ms is shown with a solid line and reveals a slope that is equivalent to 5.5 m/s. The light and dark gray lines illustrate the analytical (model*) and experimental (data*) results of Boubenec et al. (29), respectively.

