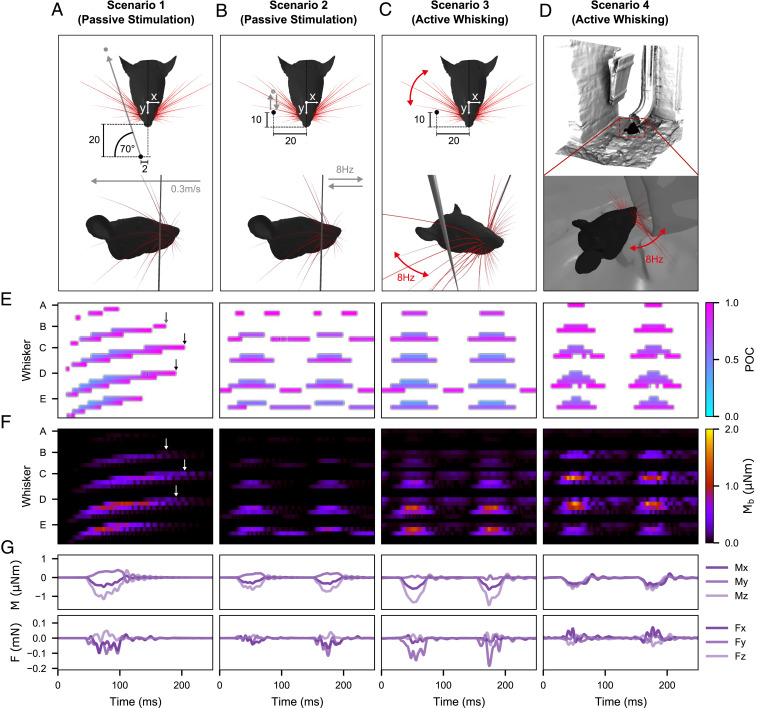
Fig. 3.
Mechanical response of the full rat whisker array for four scenarios. For simplicity, only results for the right side of the array are shown. Units are in millimeters if not indicated otherwise. (A) Visualization of the passive stimulation experiment simulating a vertical peg moving from rostral to caudal through the middle of the immobile right array. (B) Visualization of the passive stimulation experiment simulating a vertical peg moving back and forth in and out of the immobile right array at a pulse frequency of 8 Hz. (C) Visualization of active whisking against a fixed, vertical peg. The array performed a typical whisking motion as described in ref. 19 with a whisking frequency of 8 Hz. (D) Visualization of natural environment experiment. Whisking motions are the same as in C), but the array palpates the shape of a drainage pipe. (E) POCs for each whisker of the right array over time for each scenario. The POC is normalized to the length of the whisker and indicated by the color map. The whisker identities are grouped by row (dorsal to ventral) and sorted by column (caudal to rostral). Each letter on the y-axis indicates the first whisker of each group, the most caudal whisker of the corresponding row. (F) Magnitude of bending moment of each whisker indicated by color. The sorting of the whiskers is consistent with E. (G) Example of all six signal components at the base of the E2 whisker for each scenario. All panels share the same time scale (x-axis).

