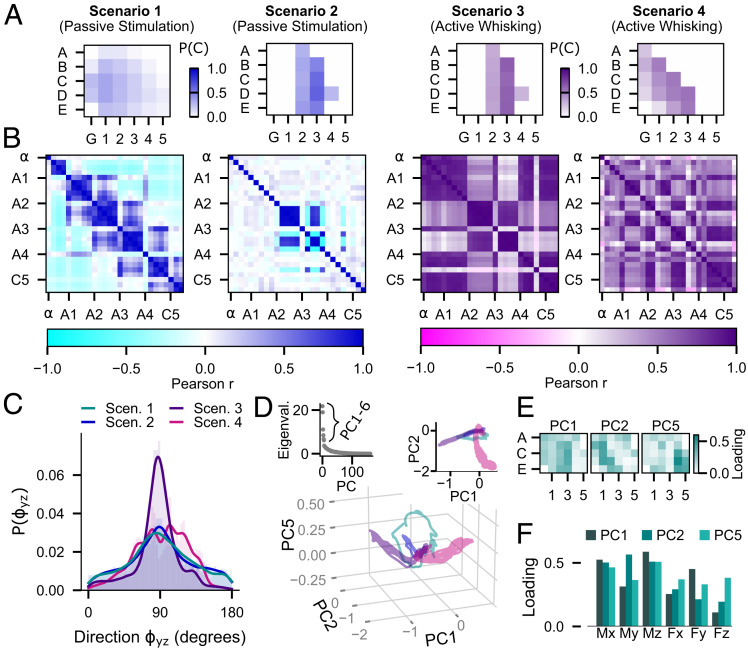
Fig. 4.
Comparison of the mechanosensory signals acquired during the four example scenarios of Fig. 3. Different color schemes are used to illustrate results for the passive and active cases. (A) Contact probability P(C) for each whisker is computed as the duration that the whisker was in contact with the object normalized by the duration of the trial. (B) Correlation matrices (Pearson r) of the bending moment between whisker pairs across the array. The whiskers are arranged in groups of the same column and ordered by row number from dorsal to ventral. The labels indicate the first whisker of each group (most dorsal whisker in each column). (C) Histograms (probability distributions) of the direction of the bending moment in degrees. The distributions of during the two types of passive stimulation with a vertical peg are very similar (two-sample Kolmogorov–Smirnov test; P = 0.08). The distribution for active whisking against a vertical peg is peaked sharply at 90°, while the distribution for active whisking against a more naturalistic surface is broad and contains many peaks, reflecting the variety of contact angles. The distributions of for active whisking are significantly different from that observed during passive stimulation and from each other (two-sample Kolmogorov–Smirnov test; P < 0.001). (D) Projection of the 162-dimensional signal space (6 mechanical components × 27 whiskers) onto the principal components PC1, PC2, and PC5 for each of the scenarios. The color code is as in C. (Inset, Left) Eigenvalues of the PCs. (Inset, Right) Projection of the mechanosensory signals into the PC1 to PC2 plane. (E) Total loadings of each whisker for each of the PCs, obtained by summing over all six mechanical components. (F) Total loadings for each of the mechanical components for each of the PCs, obtained by summing over all whiskers.

