Fig. 3.
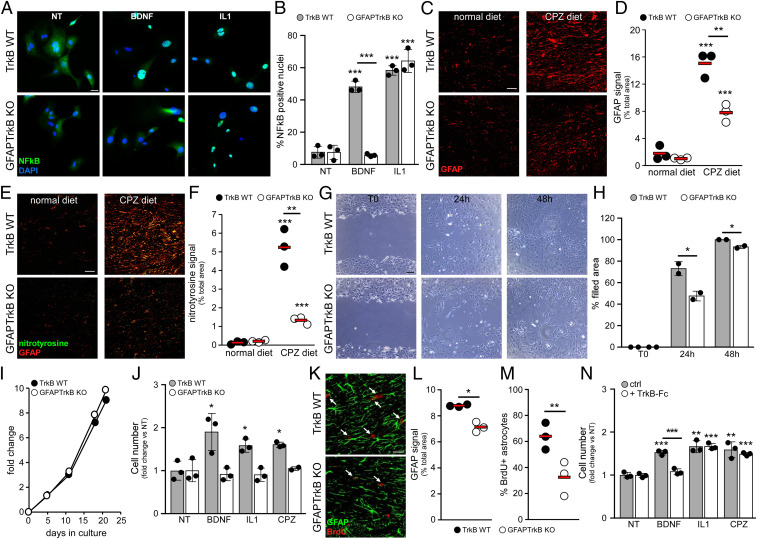
TrkB supports astrocyte functions necessary for scar formation. (A and B) Representative immunofluorescence staining (A) and quantification (B) for NF-κB in cultured TrkB WT (A, Upper) and GFAPTrkB KO (A, Lower) astrocytes (NT, not treated, or stimulated with BDNF or IL1). Cells were counterstained with DAPI. (C and D) Representative immunofluorescence staining for GFAP immunoreactivity (C) in the CC of CPZ-treated animals compared with normal diet mice (n = 3 mice/group) and relative quantification (D). (E and F) Double immunofluorescence stainings for GFAP (E, red) and nitrotyrosine (E, green) in the CC of TrkB WT and GFAPTrkB KO animals fed with normal or CPZ diet and (F) quantification of nitrotyrosine signal (n = 3 mice/group). (G and H) Representative phase contrast images (G) of TrkB WT and KO astrocyte cultures during the scratch assay and relative quantification (H). (I) Basal proliferation rate of TrkB WT and KO astrocyte cultures. (J) Proliferation of TrkB WT and KO astrocytes after exposure to BDNF, IL1, or CPZ for 7 d. (K–M) Double immunofluorescence stainings for GFAP (green) and BrdU (red) in the CC of TrkB WT and GFAPTrkB KO mice after 1 wk of the CPZ diet, and relative quantifications (L and M) (n = 3 mice/group). Arrows in K highlight BrdU+ astrocytes. (N) TrkB WT astrocyte proliferation after exposure to BDNF, IL1, or CPZ for 7 d in the presence or absence of TrkB-Fc protein. In J and N, basal proliferation (NT) after 7 d was normalized to day 0, and stimulated proliferation was expressed as fold change relative to NT. Asterisks indicate statistical significance between conditions of the same genotype. Asterisks above the bar indicate statistical significance between different genotypes. ***P < 0.001, **P < 0.01, *P < 0.05. In D, F, L, and M, each dot represents a single animal; red bars represent means. In B, H, J, and N, data are presented as mean ± SD. Representative data of one out of two to four independent experiments are shown. (Scale bars: 30 µm in A, C, E, and K; 100 µm in G.)

