Fig. 6.
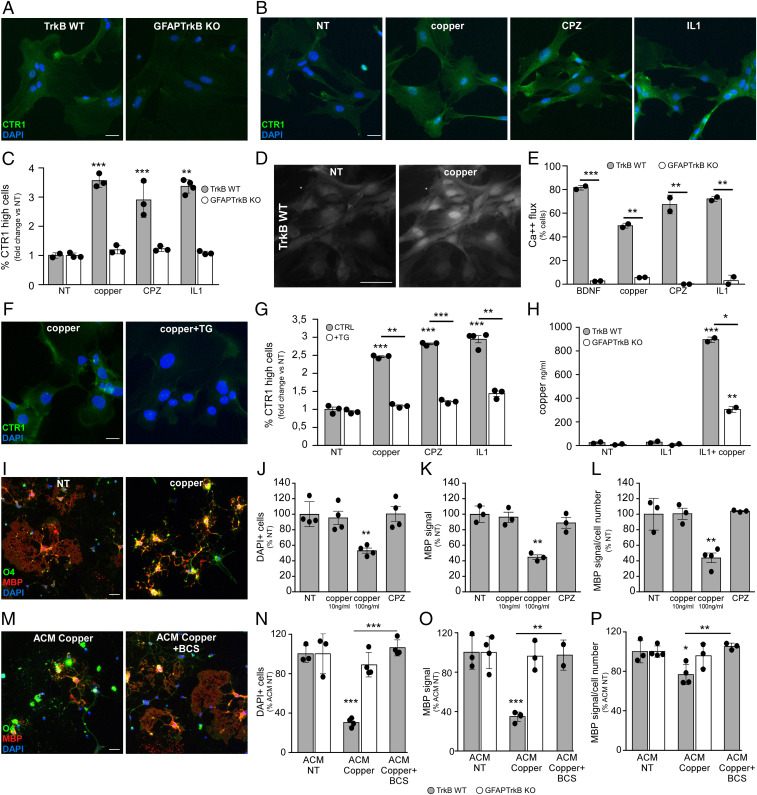
CTR1 up-regulation depends on astrocyte TrkB. (A) CTR1 staining in TrkB WT and GFAPTrkB KO astrocyte cultures. (B and C) CTR1 signal in nontreated (NT) or stimulated TrkB WT and GFAPTrkB KO astrocyte cultures (B) and relative quantifications (C). (D and E) Fluo-4 signal in untreated or copper-treated astrocytes (D) and percentage of cells performing at least 1 Ca2+ oscillation under distinct in vitro conditions (E). (F and G) CTR1 staining in copper-stimulated astrocytes in the absence (Left) or presence (Right) of calcium inhibitor thapsigargin (TG) (F) and relative quantification (G). (H) Copper levels in ACM from nontreated or stimulated astrocytes measured by inductively coupled plasma atomic emission spectrometry. (I) Representative stainings for O4 (green) and MBP (red) in oligodendrocyte cultures NT or treated with 100 ng/mL copper. (J–L) Quantification of oligodendrocyte number (J), total MBP signal (K), and relative MBP signal per cell (L) in OL cultures under distinct conditions. Data are reported as percentage of NT condition. (M) Representative stainings for O4 (green) and MBP (red) in oligodendrocyte cultures exposed to ACM from copper-loaded TrkB WT astrocytes. Eventually, ACM added with copper chelator BCS was given. (N–P) Quantification of oligodendrocyte number (N), total MBP signal (O), and relative amount of MBP per cell (P) in OL cultures treated with ACM from TrkB WT and GFAPTrkB KO astrocytes. Data are reported as percentage of the corresponding ACM NT. Asterisks indicate statistical significance between conditions from the same genotype. Asterisks above the bar indicate statistical significance between genotypes. ***P < 0.001, **P < 0.01, *P < 0.05. In A, B, F, I, and M, DAPI was used for nuclear staining. In C, E, G, J–L, and N–P, data are presented as mean ± SD. Representative data of one out of two to four independent experiments in all cases but E, where the sum of two independent experiments is reported and error bars represent SEM. (Scale bars: 30 µm.)

