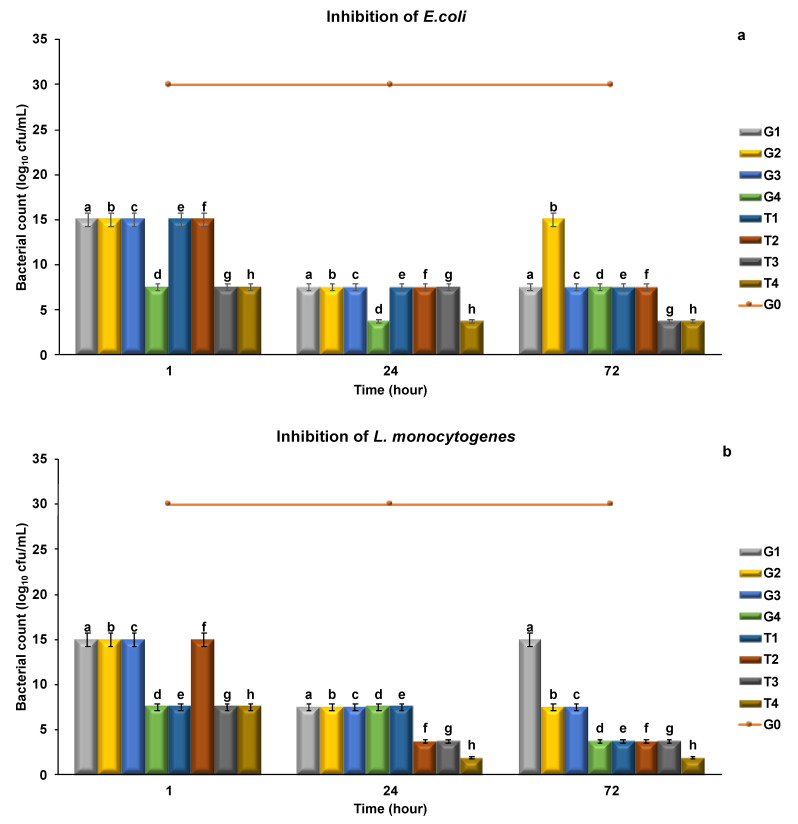
Figure 5.
MIC values of meatballs determined at different times. (a) Inhibition of E. coli, (b) Inhibition of L.monocytogenes, (c) Inhibition of S. typhimurium. The results are expressed as mean ± standard error. a–h For each day, columns representing different values are labeled with different letters.


