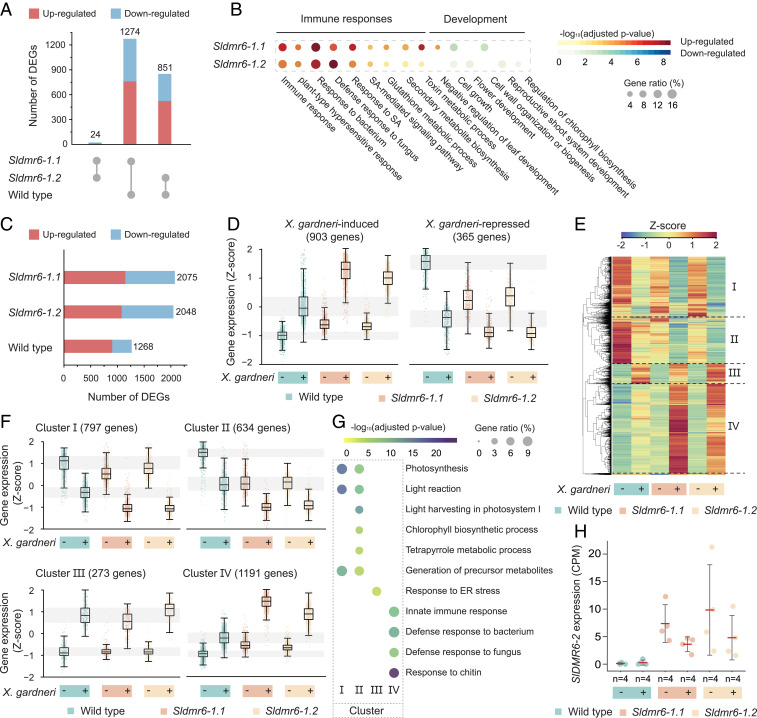
Fig. 3.
Large-scale reprogramming of the tomato transcriptome as a result of SlDMR6-1 inactivation. (A) Comparison of the number of DEGs among the wild-type, Sldmr6-1.1, and Sldmr6-1.2 lines. (B) Selected GO terms that are differentially represented in the Sldmr6-1 mutants. For a complete list of the GO enrichment analysis, please refer to Dataset S2. (C) Number of DEGs in the wild-type and Sldmr6-1 mutant lines in response to X. gardneri infection. (D) Genes up-regulated by pathogen infection are more expressed in the Sldmr6-1 lines than in wild-type plants. Similarly, down-regulated genes are less expressed in the mutants. (E) Hierarchical clustering showing groups of genes that respond to pathogen infection in the absence and presence of X. gardneri. The DEGs were classified into four clusters (I to IV). (F) Details of each hierarchical cluster. Clusters I and II consist of genes that are down-regulated by the pathogen infection in all three genotypes. In particular, genes in cluster II are repressed in the Sldmr6-1 mutants even before infection. Similarly, clusters III and IV show genes that are up-regulated by pathogen. Particularly, genes in cluster IV are slightly activated in the Sldmr6-1 mutants before infection and more expressed in response to pathogen infection. (G) Selected GO terms that are differentially represented in the four different clusters from E and F. For a complete list of the GO enrichment analysis, please refer to Dataset S5. (H) Comparison of SlDMR6-2 expression in the wild-type, Sldmr6-1.1, and Sldmr6-1.2 lines (FDR < 0.05). Units are shown as counts per millions (CPMs) normalized using the trimmed mean of M-values (TMM) in edgeR.

