Fig. 3.
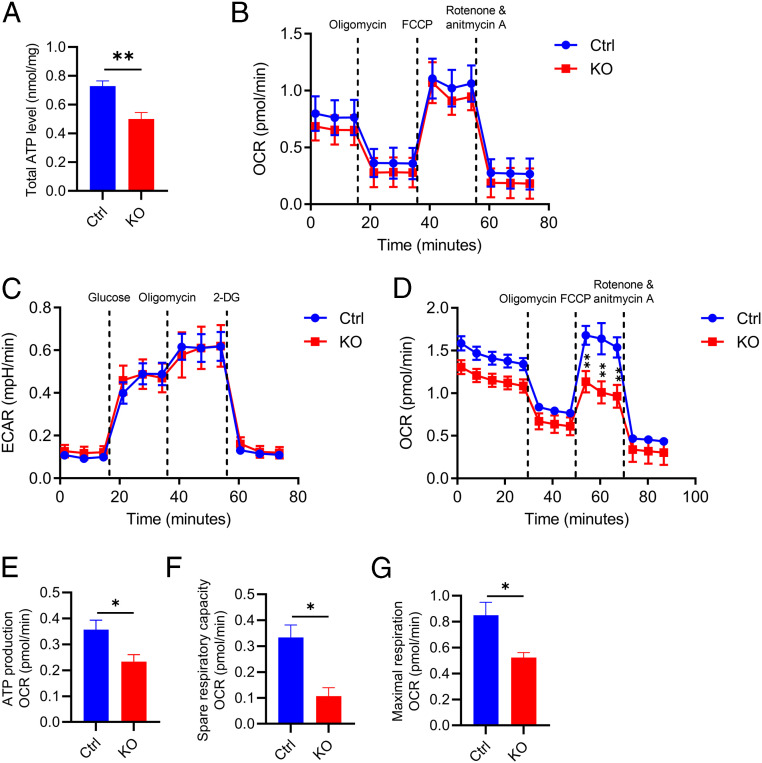
Atg7 regulates lipid metabolic homeostasis in vitro. (A) Total cellular ATP levels in WT and Atg7 KO BV2 cells. Two-tailed Student’s t test (n = 8 of two experiments). (B) OXPHOS measurement of OCR levels in control and Atg7 KO BV2 cells. Two-tailed Student’s t test (n = 3 of two experiments). (C) Glycolysis measurement of ECAR levels in control and Atg7 KO BV2 cells. Two-tailed Student’s t test (n = 3 of two experiments). (D) FAO measurement of OCR levels in control and Atg7 KO BV2 cells. Two-tailed Student’s t test (n = 3 of two experiments). (E–G) The measurement of ATP production (E), spare respiratory capacity (F), and maximal respiration (G) from D. Two-tailed Student’s t test (n = 3 of two experiments). Data are presented as mean ± SEM. *P ≤ 0.05; **P ≤ 0.01.

