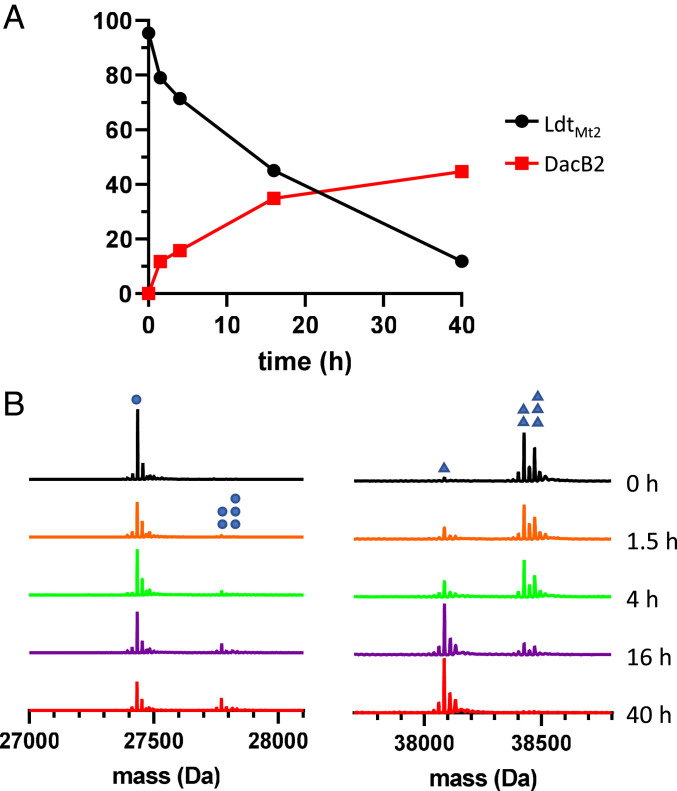
Fig. 3.
Adduct transfer from LdtMt2 to DacB2. (A) The percent bound of LdtMt2 and DacB2 are plotted versus time since admixture of LdtMt2 and DacB2. Each point is a single measurement and curve is composed of straight lines, connecting contiguous points. (B) Spectra of DacB2 (Left) collected at time points after adding LdtMt2–meropenem show apo-DacB2 (27,435 Da, single blue dot) gradually decrease as the two DacB2–meropenem species (27,774 Da, decarboxylated, two blue dots; 27,818 Da, intact, three blue dots) increase. Spectra of LdtMt2 (Right) show apo-LdtMt2 (single blue triangle, 38,086 Da) appear as LdtMt2–meropenem (38,425 Da, decarboxylated, two triangles; 38,469 Da, intact, three triangles) is consumed.

