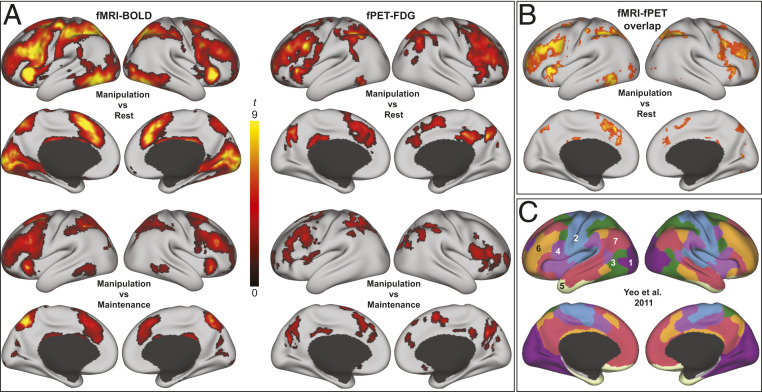
Fig. 2.
Task-related increases in BOLD signal and glucose metabolism. (A) t-maps (corrected at P < 0.05) for fMRI (Left) and fPET (Right) were overlaid on an inflated surface in workbench view. Separate maps are shown for manipulation (the difficult WM condition) compared to rest (Top) and for the contrast manipulation > maintenance (Bottom). Both modalities showed significantly larger task-induced responses to manipulation compared to maintenance. (B) Overlap between fMRI and fPET at different uncorrected t-thresholds for the manipulation task (P < 0.01 to P < 0.0001, red to yellow, respectively) are modest in visual and sensorimotor networks at lower thresholds but high convergence in FPN and DAN also at more stringent thresholds. (C) The Yeo atlas (72) is displayed to provide a point of reference for the locations of task-related changes (1 = visual; 2 = sensorimotor; 3 = dorsal attention; 4 = ventral attention; 5 = limbic; 6 = frontoparietal; and 7 = default mode network).

