Fig. 3.
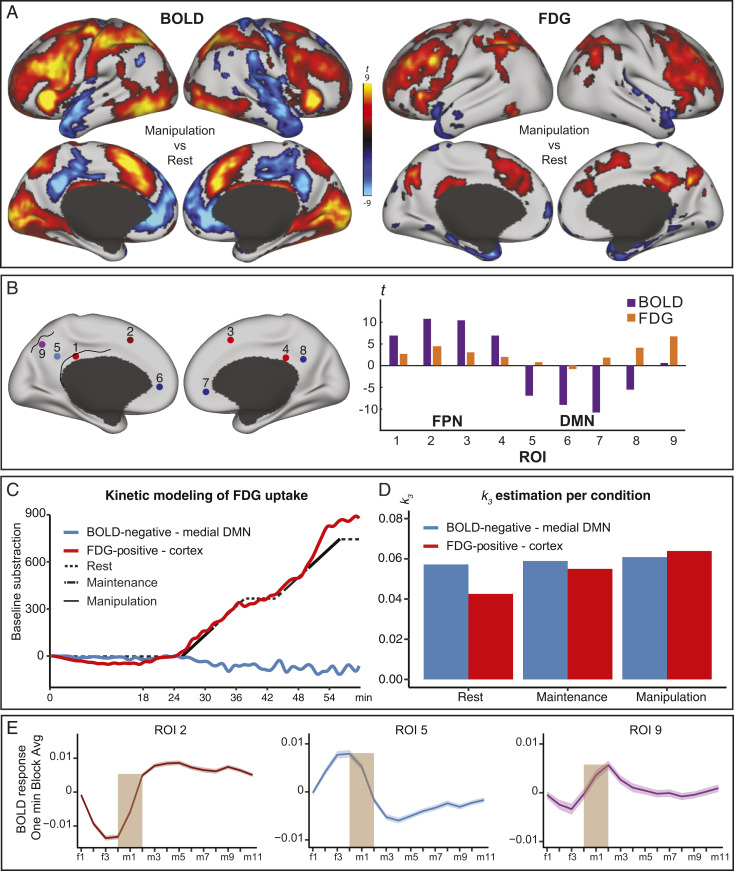
Dissociation between the BOLD response and glucose metabolism in the posterior DMN. (A) fMRI and PET data for manipulation > rest in red and manipulation < rest in blue (P < 0.05, corrected). (B) t-statistics for BOLD (purple) and FDG (orange) at four loci selected from the BOLD analysis in the FPN (red), four from the DMN (blue), and one DMN loci selected from the fPET analysis in which there was no significant BOLD increase (purple). MNI coordinates were (1 [−6 29 27], 2 [−4 14 46], 3 [8 28 32], 4 [8 33 29], 5 [−8 50 29], 6 [−12 45 1], 7 [10 42 2], 8 [8 49 33], 9 [−2 −72 36]). (C) Kinetic modeling of the FDG signal was performed in two large ROIs reflecting FDG increases (red, manipulation > rest) (cf. A) and fMRI NBR in the DMN (blue, manipulation < rest in the medial frontal and posterior DMN). Residual FDG signal in the ROIs after subtracting the estimated baseline curve is represented by the red and blue lines. The black line illustrates the task structure. (D) The estimated k3 for each condition and ROI are depicted with bars. (E) The BOLD signature in three ROIs, each representing a different multimodal pattern, are displayed for ROI 2, 5, and 9. The time-series of the 12 1-min embedded manipulation blocks were averaged across each of the four resting fixation TRs [f1 to f4] preceding each embedded task block, and the 11 TRs [m1 to m11] involving manipulation trials. The ribbon represents 1 SE. Of note, the time-series in 9 exhibits a transition-related response. DMN = default mode network, FPN = frontoparietal network, and ROI = region-of-interest.

