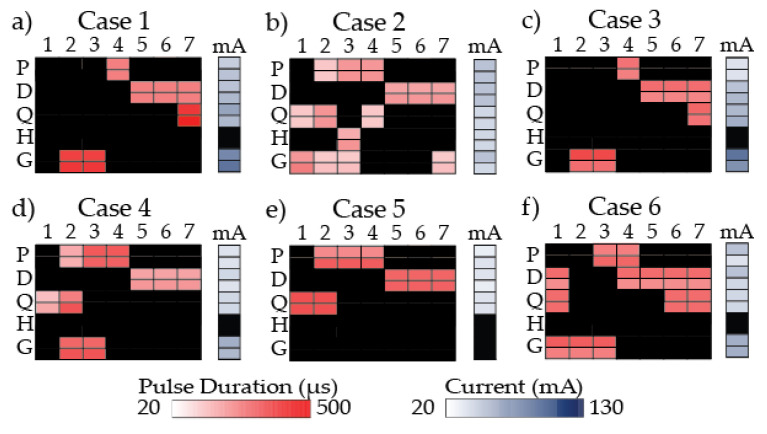
Figure 1.
Stimulation program for each participant. A heat map shows the pulse duration (µs) used for each gait phase (column) and muscle group (row) and current (mA) used for each muscle group. For each muscle group, there is a left side (top row) and right side (bottom row). Darker colors are associated with higher pulse duration in red and higher current in blue. Black indicates no stimulation. 1: loading response; 2: mid-stance; 3: terminal stance; 4: pre-swing; 5: initial swing; 6: mid-swing; 7: terminal swing; mA: current; P: plantarflexors; D: dorsiflexors; Q: quadriceps; H: hamstrings; G: gluteals.

