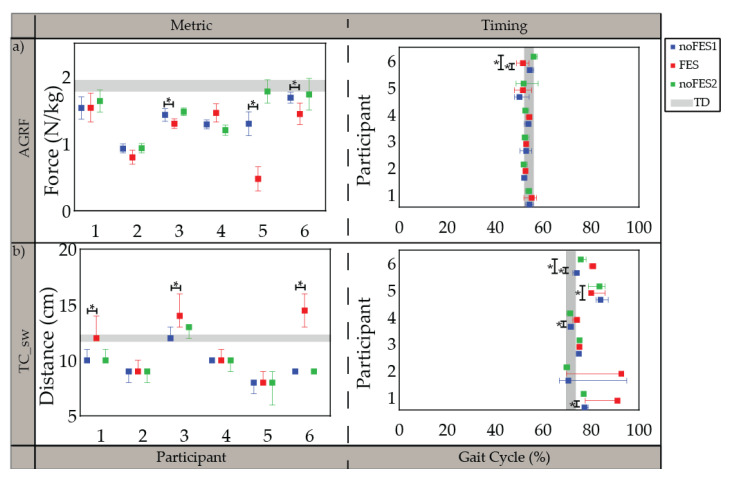
Figure 2.
Median and 95% confidence interval (CI) of gait metrics targeted by all individualized stimulation programs and timing of gait metrics (percent of gait cycle) during noFES1 (blue), FES (red), and noFES2 (green) walking conditions. (a) peak propulsive force (AGRF) and (b) minimum toe clearance in swing period (TC_sw). Gray band represents 95% CI for typically developing reference dataset (TD). * indicates significance between walking conditions.

