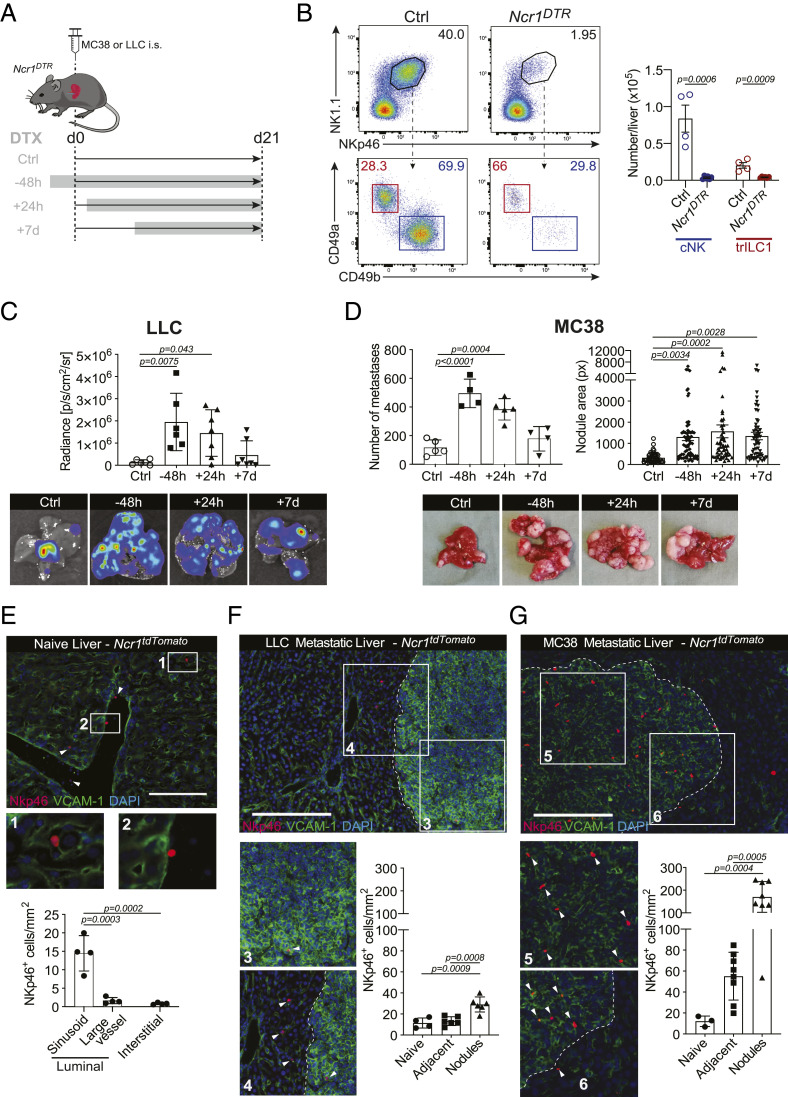
Fig. 1.
Control of hepatic metastases depends on NKp46+ cells. (A) Experimental schedule for NKp46+ depletion. NKp46+ cells were depleted by an injection of 250 ng DTX i.p. 48 h before, 24 h after, or 7 d after tumor injection. Depletion was maintained until the endpoint. Ncr1DTR = Ncr1iCre/wt.R26RiDTR/wt; Ctrl = undepleted control mice (Ncr1iCre/wt.R26Rwt/wt, group injected at time point −48 h); i.s. = intrasplenic. (B) Representative dot plots (Left) and quantification (Right) of cNKs and trILC1s in Ctrl and Ncr1DTR livers. Samples were pregated on single live CD45+lineage− cells and subsequently gated on NK1.1+NKp46+ cells. cNK = conventional NK cells, CD49a−CD49b+; trILC1 = tissue-resident ILC1s, CD49a+CD49b−. (C, Upper) Quantification of LLC liver nodules by in vivo imaging system (IVIS) at the endpoint. Bioluminescence measurements on the whole liver are shown. (Lower) Representative IVIS images of metastatic livers from each group at the endpoint. The bar represents the mean ± SD, and the symbols represent livers from individual mice. One-way ANOVA with Tukey’s multiple comparisons test. The experiment was performed twice with similar results. (D, Upper) Quantification of MC38 macroscopic liver nodules and their area at the endpoint. The area of each hepatic nodule is measured manually using the drawing tool from ImageJ. Each point represented corresponds to the area of one nodule displayed in pixels (px). (Lower) Representative images of metastatic livers from each group at the endpoint. The bar represents the mean ± SD, and the symbols represent livers from individual mice. One-way ANOVA with Tukey’s multiple comparisons test. The experiment was performed twice with similar results. (E–G) Representative immunofluorescence image and quantification of NKp46+ cell vascular localization. Ncr1tdTomato = Ncr1Cre/wt.R26RAi14/wt. Three livers per experimental condition were analyzed, and each symbol represents an individual section. The distribution of NKp46+ cells was determined based on their positioning relative to the liver vasculature (luminal side of the sinusoids or large vessels, or interstitial). (E) Naïve liver. (Scale bar, 50 µm.) (F) LLC metastatic liver. (G) MC38 metastatic liver. (Scale bar, 100 µm.)

