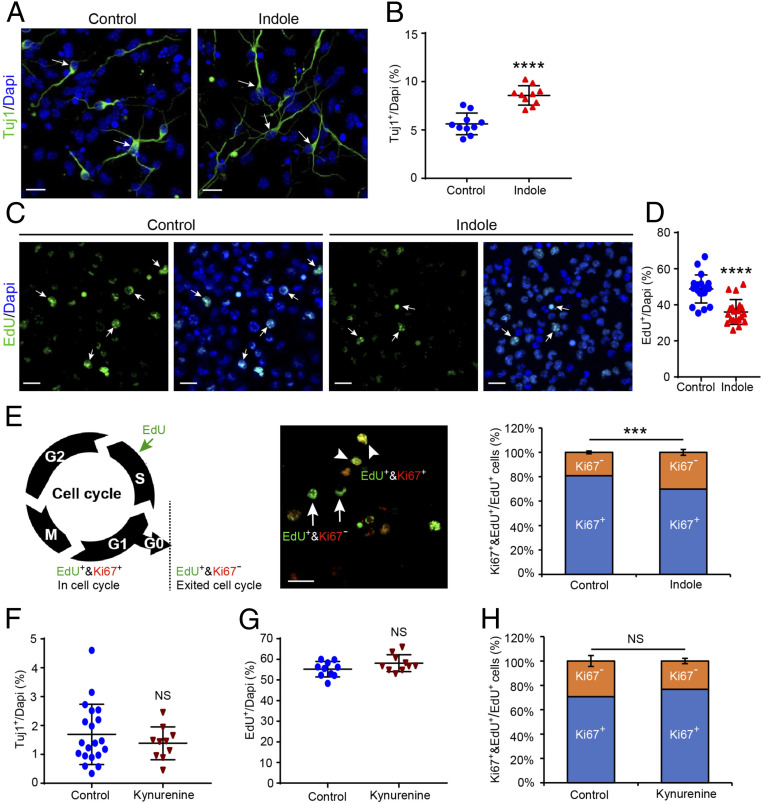
Fig. 2.
Indole, not kynurenine, exerts neurogenic effects on neuronal progenitor cells ex vivo. (A) Representative images of class III Tuj1-immunostained neurons (green) in NPC cultures treated with indole- (100 μM) or vehicle-supplemented media for 4 d. The white arrows indicate Tuj1+ neurons. (Scale bar: 20 μm.) (B) Quantification of Tuj1+ neuron populations reveal that indole treatment enhances neurogenesis (n = 10 views/coverslip from n = 3 separate NPC cultures). (C) Representative images of EdU+ cells (green) 24 h after labeling (0.001 µM) and treatment with indole- (100 μM) or vehicle-supplemented media. The white arrows indicate EdU+ cells. (Scale bar: 20 μm.) (D) Quantification of EdU+ cell populations reveal that indole treatment significantly reduces proliferation of NPCs (n = 20 views/coverslips from n = 3 separate NPC cultures). (E, Left) Diagram indicating the markers used to assess cell cycle stage. (Middle) Representative image of double-labeled EdU+&Ki67+ cells in cell cycle (arrowhead) and single-labeled EdU+&Ki67− cells out of cell cycle (arrow). (Scale bar: 20 μm.) (Right) Quantification of EdU+&Ki67+ versus EdU+&Ki67− reveals that indole treatment significantly increases NPC cell cycle exit. (F–H) Quantification of (F) Tuj1+ neuron populations (G), EdU+ cell populations and (H), EdU+&Ki67+ versus EdU+&Ki67− cells in kynurenine- (100 μM) or vehicle-treated NPC cultures shows kynurenine has no effect on NPCs (n > 10 views/coverslip from n = 3 separate NPC cultures). All data are presented as mean ± SEM. Statistical differences were determined using Mann–Whitney U test. Asterisks indicate a significant difference between groups (****P < 0.0001, ***P < 0.001, and NS represents nonsignificant differences).

