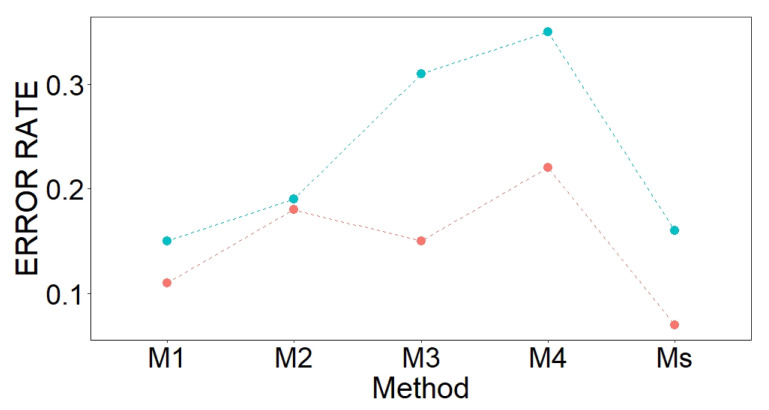
Figure 11.
Error rates derived from the sPLS-DA and RF algorithms. Red points are OOB classification error rates per method, based on different sets of classification variables: M1, M2, M3, M4 and all variables (Ms). Blue points are mean values of BER for all the components, per method, for sPLS-DA.

