Fig. 1.
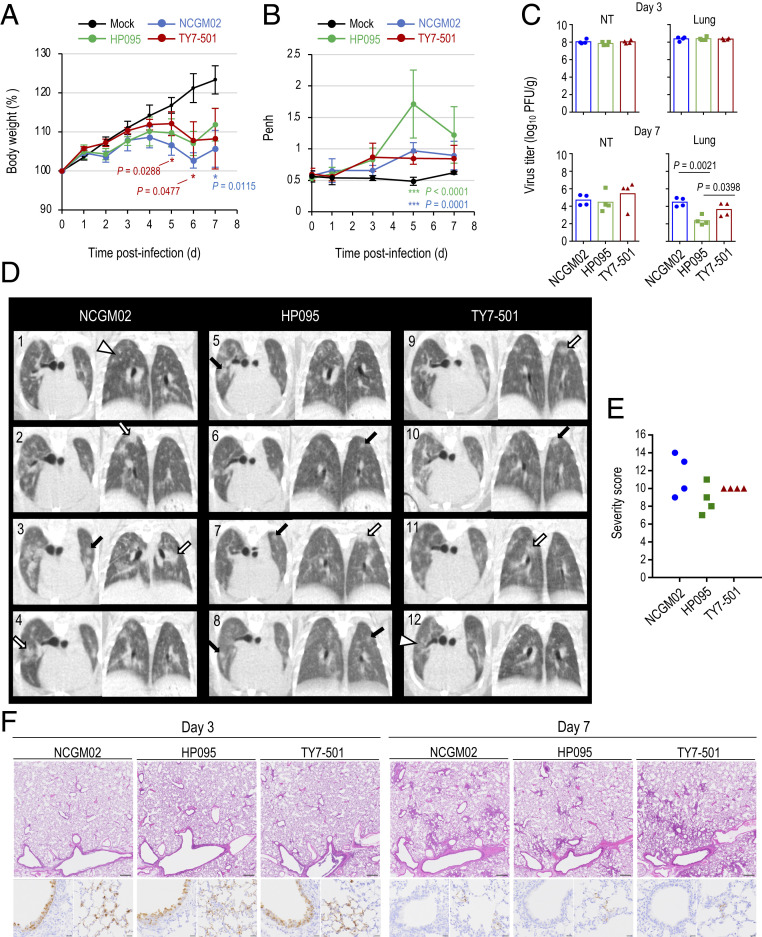
Virus replication and pathological findings in Syrian hamsters infected of the SARS-CoV-2 P.1 variant. Four Syrian hamsters per group were intranasally inoculated with 103 PFU (in 30 μL) of hCoV-19/Japan/TY7-501/2021(TY7-501), SARS-CoV-2/UT-NCGM02/Human/2020/Tokyo (NCGM02), SARS-CoV-2/UT-HP095-1N/Human/2020/Tokyo (HP095), or phosphate-buffered saline (PBS) (mock). (A) Body weight changes in hamsters were monitored daily for 7 d after viral infection. Data are presented as the mean percentages of the starting weight (± SD). P values were calculated by using pairwise comparisons after a linear mixed model analysis (*P < 0.05). Red and blue asterisks indicate statistically significant differences between TY7-501−infected and NCGM02-infected animals and between NCGM02- and HP095-infected animals. (B) Pulmonary function analysis in infected hamsters. Penh, which is a surrogate marker for bronchoconstriction or airway obstruction, was measured by using WBP. Data are presented as the mean ± SD. P values were calculated by using pairwise comparisons after a linear mixed model analysis (***P < 0.001). Green and blue asterisks indicate statistically significant differences between TY7-501−infected and HP095-infected animals and NCGM02- and HP095-infected animals. (C) Syrian hamsters were euthanized on days 3 and 7 postinfection for virus titration. Virus titers in the nasal turbinates and lungs were determined by use of a plaque assay on VeroE6/TMPRSS2 cells. Vertical bars show the mean. Points indicate data from individual Syrian hamsters. NT, nasal turbinate. P values were calculated by using a one-way ANOVA, followed by Tukey’s post hoc test. (D) Micro-CT imaging of the lungs of infected hamsters on day 7 postinfection. Axial and dorsal/coronal plane CT images of the thorax in animals infected with NCGM02 (1 to 4), HP095 (5 to 8), or TY7-501 (9 to 12). Lung abnormalities included multifocal nodules (black arrows), ground glass opacity (white arrowheads), and regions of lung consolidation (white arrows) that were peripheral, bilateral, and multilobar. (E) CT severity score of TY7-501−infected, NCGM02-infected, and HP095-infected Syrian hamsters. NCGM02-infected animals had the highest CT severity score; HP095-infected animals had the lowest CT severity score. (F) Representative histopathological images of the lungs of hamsters infected with the indicated viruses on days 3 and 7 postinfection. (Upper) Hematoxylin/eosin (H&E) staining. (Lower) Immunohistochemistry (IHC) for SARS-CoV-2 antigen detection in bronchi (Left) and alveoli (Right). (Scale bars: H&E staining, 500 μm; IHC, 20 μm.)

