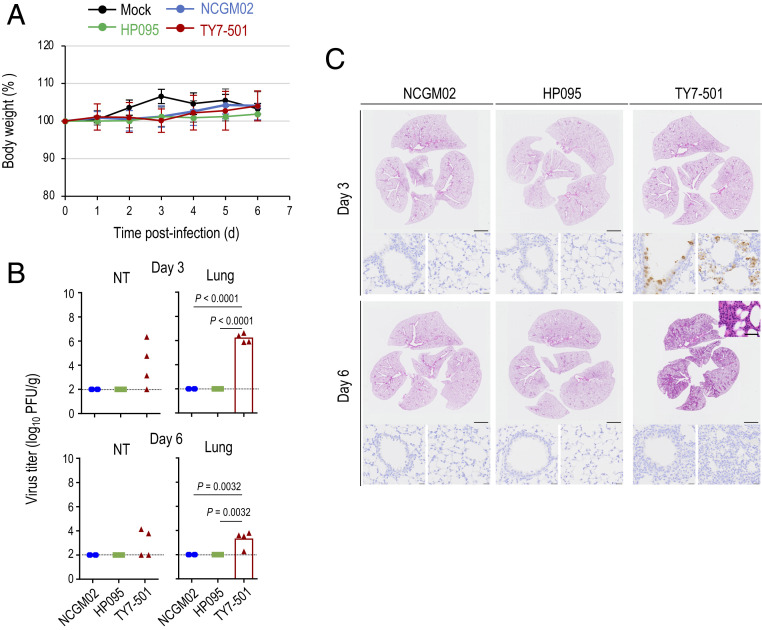
Fig. 2.
Virus replication and pathological findings in mice infected with the SARS-CoV-2 P.1 variant. Mice were intranasally inoculated with 105.7 PFU (in 50 μL) of TY7-501, NCGM02, HP095, or PBS (mock). (A) Body weights of virus-infected (n = 7) and mock-infected mice (n = 7) were monitored daily for 6 d after viral infection. Data are presented as the mean percentages of the starting weight (±SD). P values were calculated by using pairwise comparisons after a linear mixed model analysis. (B) Four mice per group were euthanized on days 3 and 6 postinfection for virus titration. Virus titers were determined as described in the legend to Fig. 1. Vertical bars show the mean. The vertical bar is shown only when virus was recovered from all four mice. Points indicate data from individual mice. P values were calculated by using a one-way ANOVA, followed by Tukey’s post hoc test. The lower limit of detection is indicated by the horizontal dashed line. (C) Representative histopathological images of the lungs of mice infected with the indicated viruses on days 3 and 6 postinfection. (Upper) H&E staining. (Lower) IHC for SARS-CoV-2 antigen detection in bronchi (Left) and alveoli (Right). (Inset) higher magnification showing hyaline membrane formation in alveoli. (Scale bars: H&E staining, 2 mm; IHC, 20 μm; Inset, 20 μm.)

