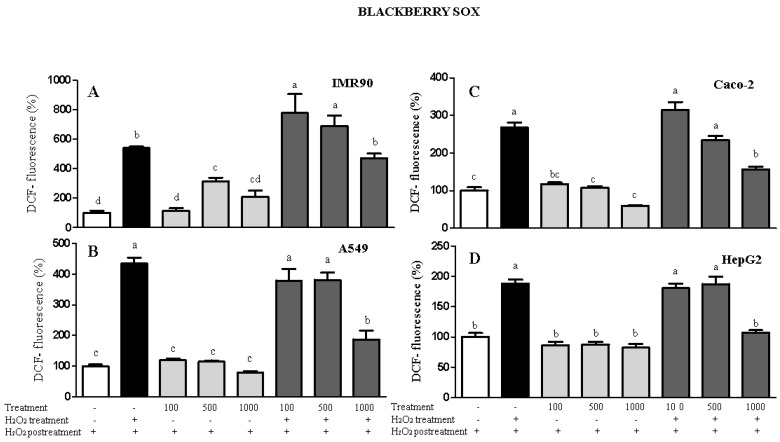
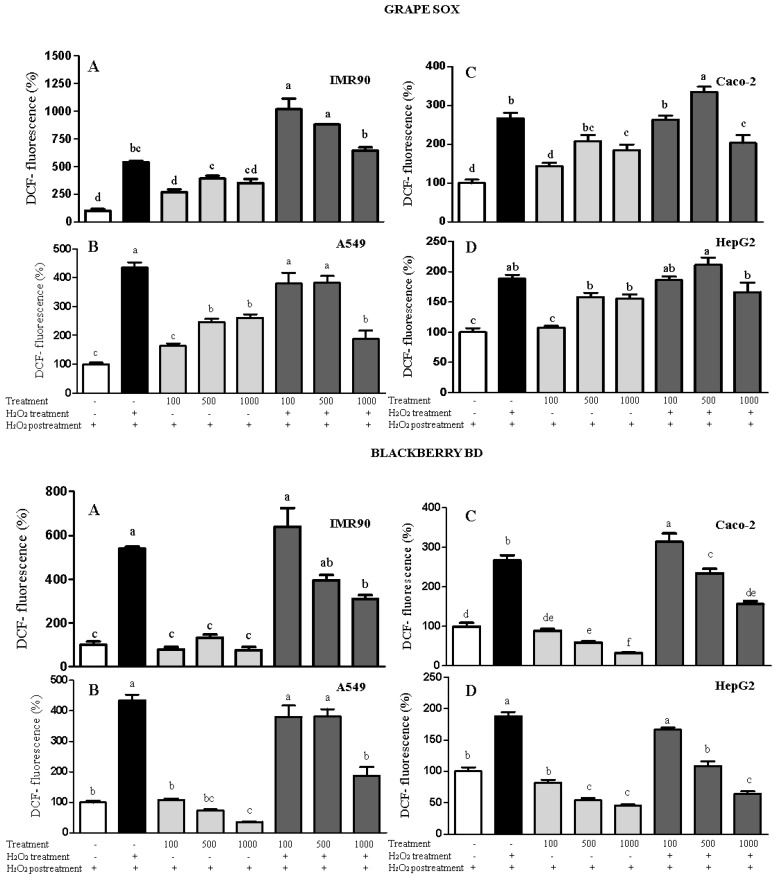
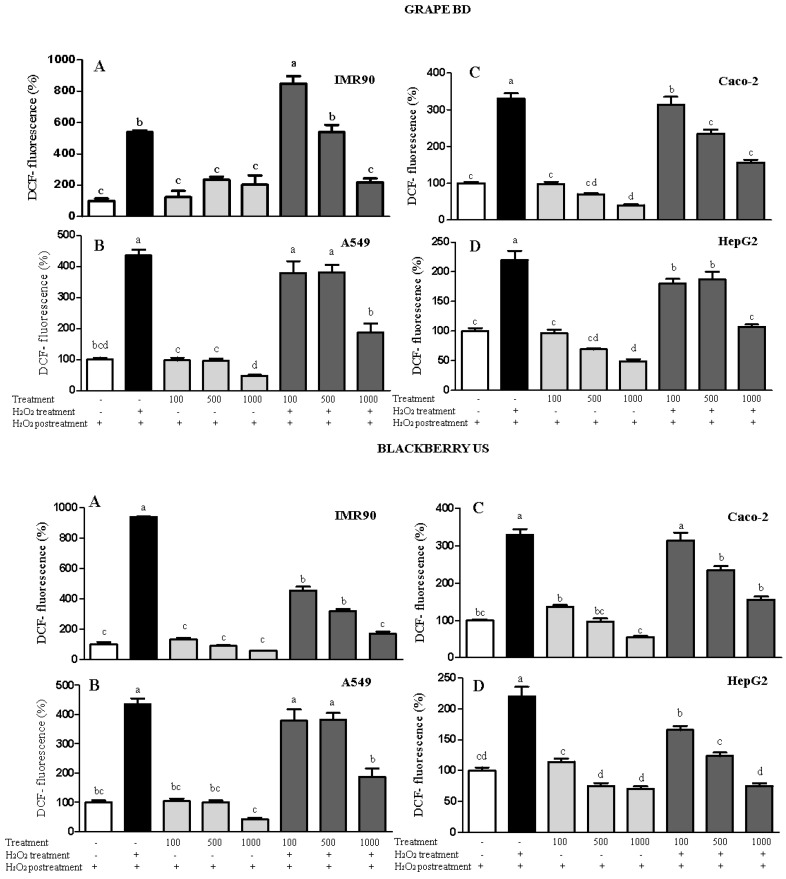
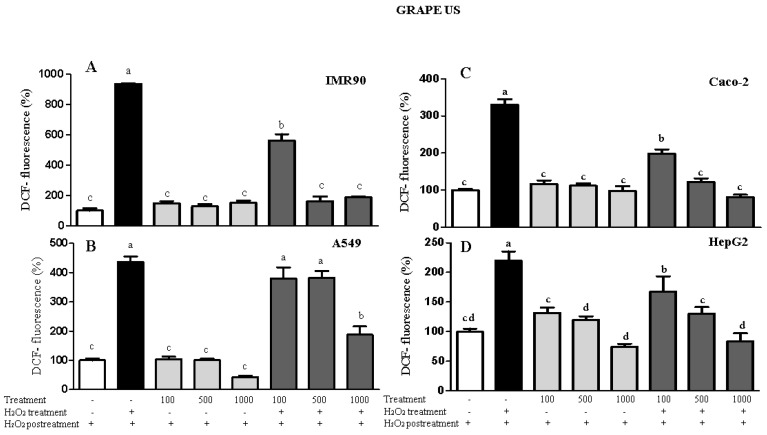
Figure 2.
Results of the measurement of intracellular ROS in IMR90 (A), A549 (B), Caco-2 (C), and HepG2 (D) cells via spectrofluorimetry. Treatment = non-polar blackberry and grape seed extracts at 100–1000 μg/mL. Different letters comparing the treatments represent statistically different results at p < 0.05.


