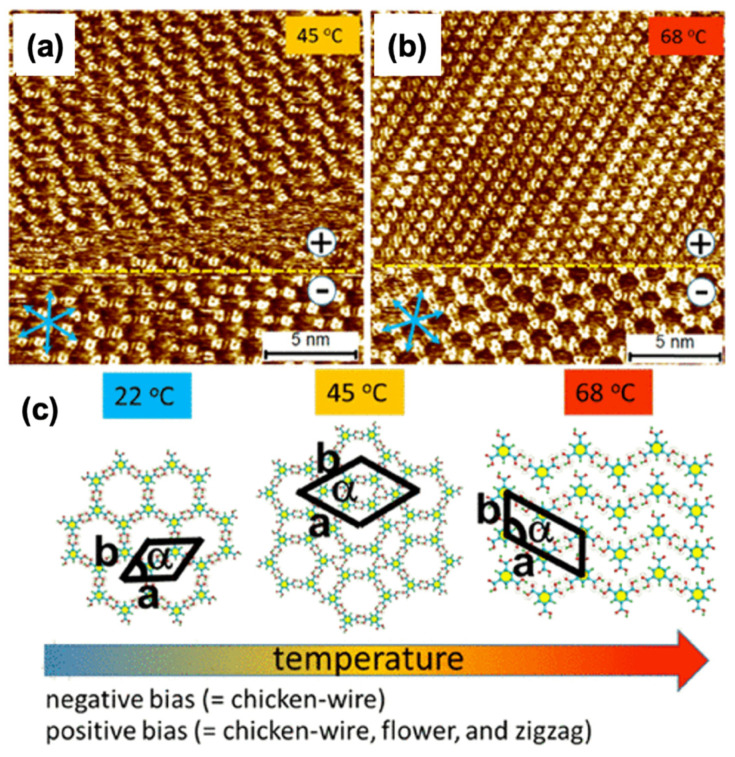
Figure 9.
Represents temperature and electric polarity interrelated polymorphs showing the swapping between (a) chicken-wire, (b) flower and compact TMA assemblies. (c) Phase transformation diagram of TMA via thermal and electrical stimuli. Imaging conditions (Vbias, It): ±0.85 V, 100 pA. The polarity of STM bias and the environmental temperature for STM imaging are noted in the image. Unit cell parameters a, b, and α for a chicken-wire motif for flower: 2.7 (±0.2) nm, 2.8 (±0.3) nm, and 60° (±2°); for compact: 1.0 (±0.2) nm, 1.8 (±0.2) nm, 87° (±3°). Blue arrows indicate the lattice-structure dimension of HOPG Reproduced from ref. [11] with permission from the American Chemical Society.

