Fig. 4.
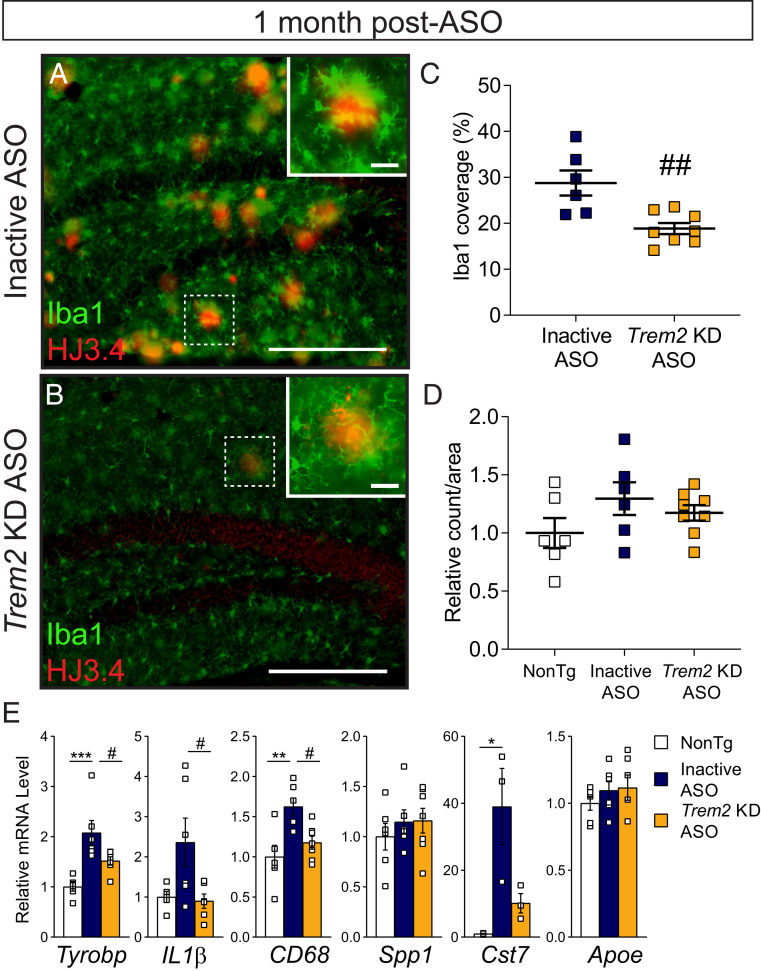
Microglial localization and genetic responses are blunted 1 mo following late-stage Trem2 reduction. Brain tissue from 11-mo-old APP/PS1 mice treated with (A) inactive or (B) Trem2 KD ASO 1 mo prior was labeled with Iba1 to identify microglia (green) and HJ3.4 to identify amyloid beta plaques (red). Representative images are shown. (Scale bar, 250 μm, inset 25 μm.) (C) The area of Iba1+ coverage of plaques per animal and (D) total Iba1+ counts were quantified within the hippocampus following inactive ASO (n = 6) or Trem2 KD ASO (n = 8) treatment. Nontransgenic (NonTg) mice (n = 6) included for total microglia quantification. Data are mean ± SEM; unpaired t test or one-way ANOVA; ##P < 0.01. (E) mRNA levels of select inflammatory or microglial markers were measured by qRT-PCR and normalized to GAPDH (open square represent individual mice; n = 3 to 7/treatment). Data are mean ± SEM relative to NonTg; one-way ANOVA with Tukey’s multiple comparison test; *P < 0.05, **P < 0.01, ***P < 0.001 versus NonTg; #P < 0.05 versus inactive ASO.

