Fig. 2.
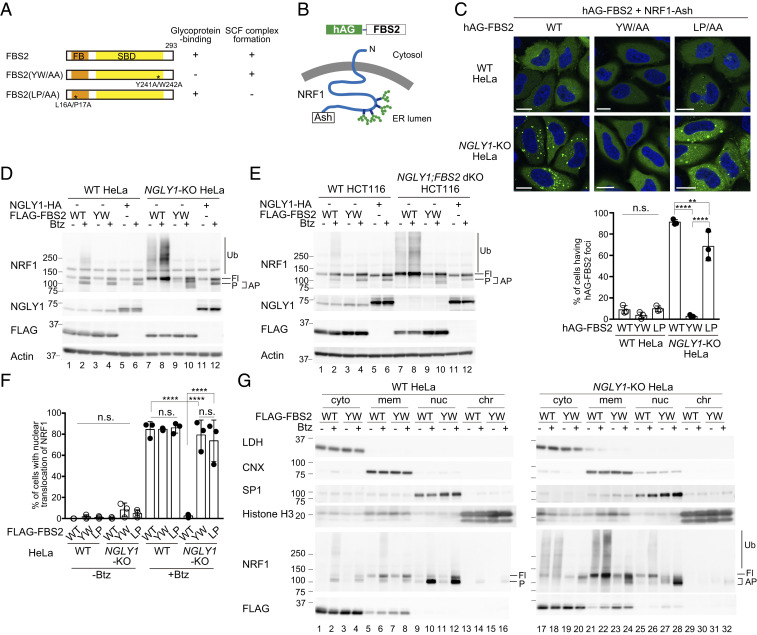
Ubiquitination of NRF1 by SCFFBS2 suppresses its activation in response to a proteasome inhibitor in NGLY1-KO cells. (A) Schematic representation of FBS2 and its mutants used in this study. Glycoprotein-binding and SCF complex formation abilities (SI Appendix, Fig. S2A) are also summarized. FB: F-box domain, SBD: sugar-binding domain. (B) Topology of NRF1-Ash and hAG-FBS2, used in the Fluoppi assay. (C) Fluoppi assay demonstrating an interaction between FBS2 and NRF1 in NGLY1-KO HeLa cells. (Upper) Wild-type (WT) or NGLY1-KO HeLa cells were transiently transfected in combination with hAG-FBS2 or its mutants and NRF1-Ash. Foci of hAG-FBS2 or its mutants were observed by confocal microscopy. (Scale bars, 20 μm.) (Lower) Quantification of cells with hAG-FBS2 foci. Percentages of cells with more than three foci are shown. Error bars show means ± SD of three biological replicates. Over 120 cells were counted in each of three replicate dishes. (D and E) Ubiquitination of NRF1 by SCFFBS2 in NGLY1-KO cells (D: HeLa cells; E: HCT116 cells). Cells stably expressing FLAG-FBS2, FLAG-FBS2 YW/AA mutant (equivalent to the no-expression control shown in SI Appendix, Fig. S2C), or NGLY1-HA were treated with or without 20 nM bortezomib (Btz) for 5 h before harvesting. Cell lysates (15 μg each) were analyzed by immunoblotting. Fl, unprocessed full-length NRF1; P, processed NRF1; AP, abnormally processed NRF1; and vertical lines (Ub), ubiquitinated NRF1. (F) Nuclear translocation of NRF1-HA in response to bortezomib (Btz) treatment in WT and NGLY1-KO cells overexpressing FLAG-FBS2 or mutants. Quantification of cells with nuclear translocation of NRF1 is based on the image in SI Appendix, Fig. S2D, with three biological replicates. Positive nuclear translocation of NRF1 was confirmed by detection of prominent unstained nucleoli in nuclei immunostained with anti-HA antibody. Over 110 cells were counted in each of three replicate dishes. (G) Subcellular distribution of endogenous NRF1 in WT and NGLY1-KO cells overexpressing FLAG-FBS2 or its lectin mutant (YW). Fl, unprocessed full-length NRF1; P, processed NRF1; AP, abnormally processed NRF1; vertical line (Ub), ubiquitinated NRF1; cyto, cytosol fraction; mem, membrane fraction; nuc, nuclear soluble fraction; and chr, chromatin-bound fraction. LDH, lactate dehydrogenase (cytosol marker); CNX, calnexin (ER marker); SP1, soluble nuclear protein marker; and Histone H3 (chromatin fraction marker). Statistical significance was determined using one-way ANOVA with Tukey’s posttest (E and F). ****P < 0.0001, **P < 0.002, n.s., not significant.

