Fig. 4.
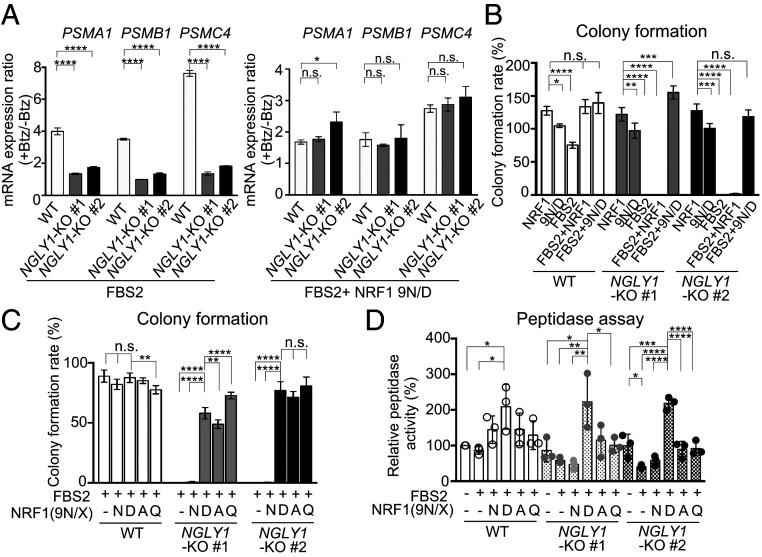
“Glycan-less” NRF1 mutants restore cell growth of FBS2-overexpressing NGLY1-KO cells. (A) Restoration of the bounce-back response of NGLY1-KO HeLa cells by sequence-edited NRF1 9N/D in the presence of proteasome inhibitor. Wild-type (WT) and NGLY1-KO HeLa cells overexpressing FBS2 (Left) or FBS2 and NRF1 9N/D (Right) were treated with Btz for 16 h. mRNA levels of the proteasome genes PSMA1, PSMB1, and PSMC4 in WT and NGLY1-KO HeLa cells were then quantified by qPCR. mRNA levels of target genes were normalized against the corresponding levels of GAPDH mRNA. Error bars show means ± SD of three biological replicates (SI Appendix, Fig. S5B). The ratio of relative mRNA expression of cells between Btz-treated and untreated are shown. (B and C) Colony formation assays in WT and NGLY1-KO HeLa cells overexpressing the indicated proteins. Colony formation rates were calculated relative to the number of colonies in GFP-overexpressing cells. Cells were counted in each of four replicates. (D) Chymotryptic peptidase activity of the proteasome in lysates of WT and NGLY1-KO HeLa cells or cells overexpressing FBS2 with or without NRF1 or NRF1 mutants. Error bars show means ± SD of three biological replicates. Statistical significance was determined by one-way ANOVA with Dunnett’s posttest (A and B) or one-way ANOVA with Tukey’s posttest (C and D). ****P < 0.0001; ***P < 0.0002; **P < 0.002; *P < 0.03, n.s., not significant.

