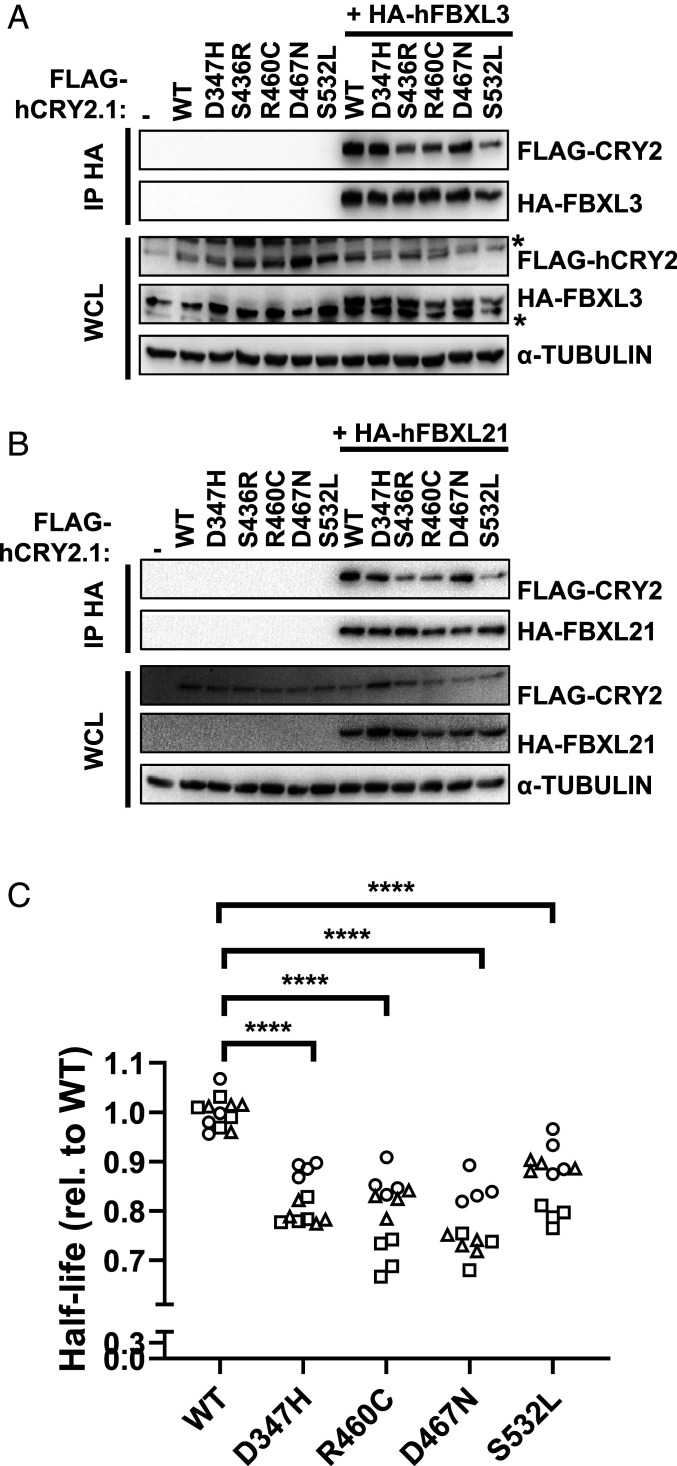
Fig. 2.
CRY2 S436R, R460C, and S532L exhibit reduced interaction with F-box proteins. (A and B) Proteins detected by immunoblot (IB) following HA immunoprecipitation (IP) or in whole-cell lysates (WCL) from HEK293T cells expressing the indicated plasmids with the indicated tags. * denotes nonspecific band. (C) Half-life of CRY2-Luciferase fusions proteins containing the indicated missense mutations in CRY2 expressed in AD293 cells. Each symbol represents the half-life calculated from fitting luminescence data recorded continuously after addition of cycloheximide to an exponential decay function. Data represent three independent experimental replicates indicated by different symbols, each performed in quadruplicate. ****P ≤ 0.0001 by two-way ANOVA with Tukey’s multiple comparison test.

