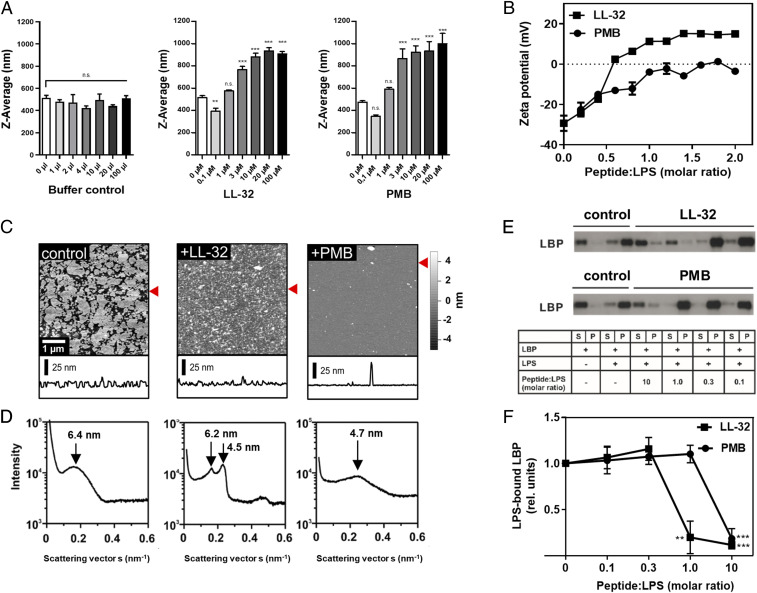
Fig. 3.
LL-32 and PMB affect the supramolecular organization and binding interactions of LPS. (A) The size of LPS aggregates (1 µM) was determined by dynamic light-scattering experiments at 37 °C. Buffer (volume control) or peptides were added at the indicated final concentrations. The data represent the means ± SEM of n = 4 (buffer control), n = 7 (LL-32), and n = 5 (PMB) independent experiments. Data were analyzed as peptide versus control by one-way ANOVA with Dunnett’s post test. **P ≤ 0.01 and ***P ≤ 0.001; n.s., not significant. (B) Zeta potentials of LPS aggregates in solution. LL-32 and PMB were titrated to LPS at the indicated molar ratios. The data represent the means ± SEM of two independent experiments with three technical replicates. (C) AFM images and height profiles of solid-supported layers of LPS WBB01. LPS was immobilized as the control or preincubated with peptide at a ratio of 2:1 (by weight). Data are representative of n = 3 independent experiments. The red arrows label the line of the respective height profile. All AFM images were only flattened and not further processed. (D) SAXS diffractograms of pure LPS aggregates (Left) and aggregates prepared in the presence of LL-32 (Middle) or PMB (Right) at a LPS:peptide ratio of 2:1 (by weight). The diffractograms are representative of n = 3 independent experiments. The respective repeating distances are indicated by arrows. (E) LPS (4.55 µM) and LBP (500 ng) were coincubated with peptide for 30 min at room temperature and subsequently sedimented via ultracentrifugation. Supernatant (S) and pellet (P) fractions were separated by SDS-PAGE and immunoblotted to detect LBP. Representative images of the blots of LL-32 (Upper) and PMB (Lower) from n = 4 independent experiments each are shown. (F) Quantification of the band intensities of the pellet fractions. The data were quantified using Image J software, and the pixel intensities of the pellet fractions were normalized to the control sample (LBP + LPS). The statistical analyses by one-way ANOVA and Dunnett’s post test. The graph presents the means ± SEM of n = 4 independent experiments; **P ≤ 0.01 and ***P ≤ 0.001 (LPS only versus LPS + peptide).

