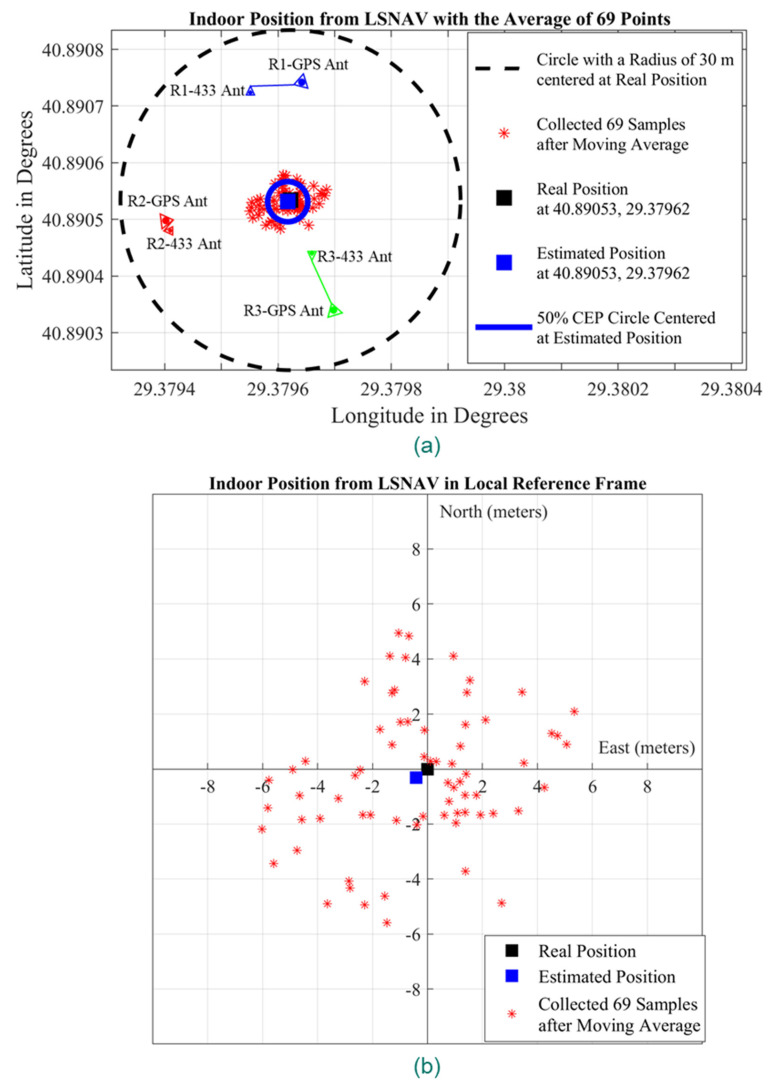
Figure 15.
The results of the Experiment 1: (a) repeater positions, outdoor GPS antenna positions, collected samples (red dots), real position of the receiver (black square), estimated position (blue square), and CEP (blue circle) on latitude–longitude graph; (b) collected samples (red dots), real position of the receiver (black square), estimated position (blue square) on local reference frame whose center is the real position of the receiver.

