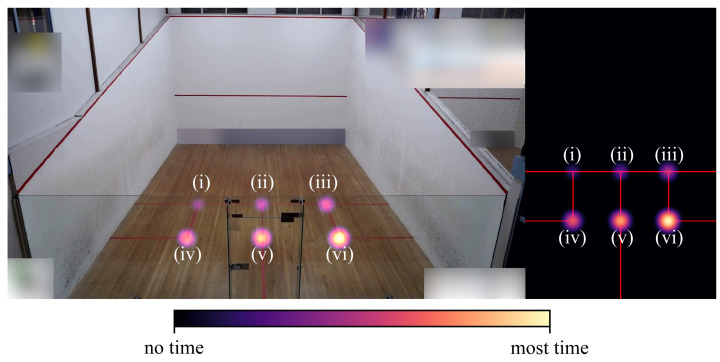
Figure 5.
Synthetic heatmaps illustrating the use of a color scale to encode location and time. Heatmap overlaid on a video frame (left) and a virtual top-down view (right). (i)–(vi) indicate six different court locations and, by means of a color scale, the different durations of time for which a player occupied a location during matchplay. For better visualization, the gaussian kernel was used to increase the accumulator values, and was parameterized with px and a standard deviation for this figure only.

