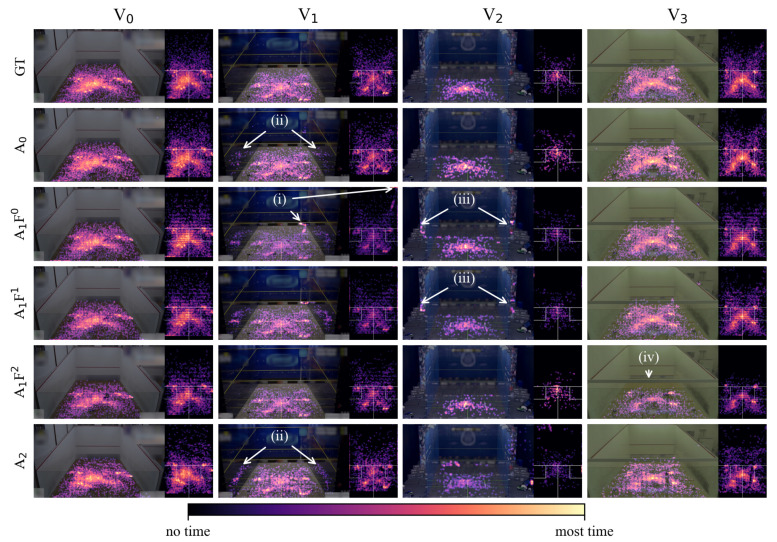
Figure 8.
Heatmap visualization reveals differences between HPE-CNN detections and ground truth labels. Each column shows one video V–V. The first row depicts the ground truth obtained from labels. Rows 2–6 show detection results for every HPE-CNN evaluated on every video. Heatmaps show labels, and the respective detections for both players. False detections (i)–(iii) result in color differences with respect to the same location in the ground truth heatmap. Reflections of players (ii) and audience (iii) are challenges, specific to glass courts. For AF, the support beam in video V disrupts detections.

