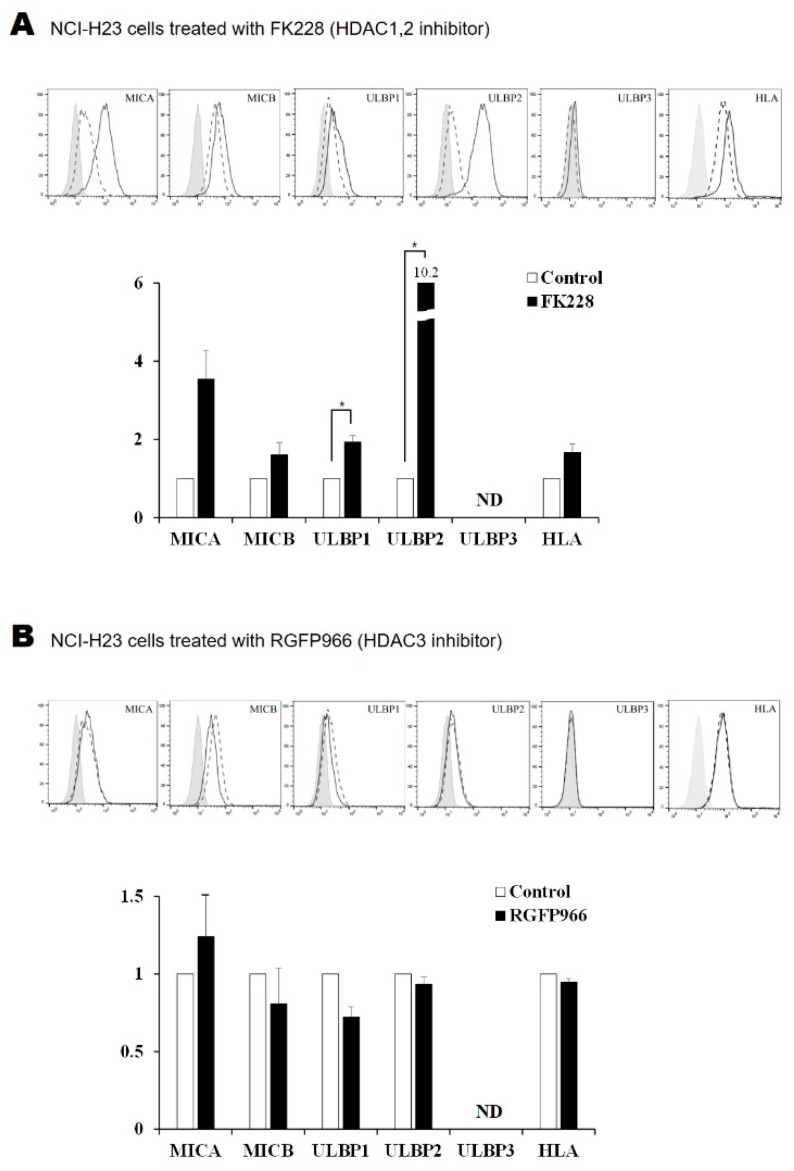
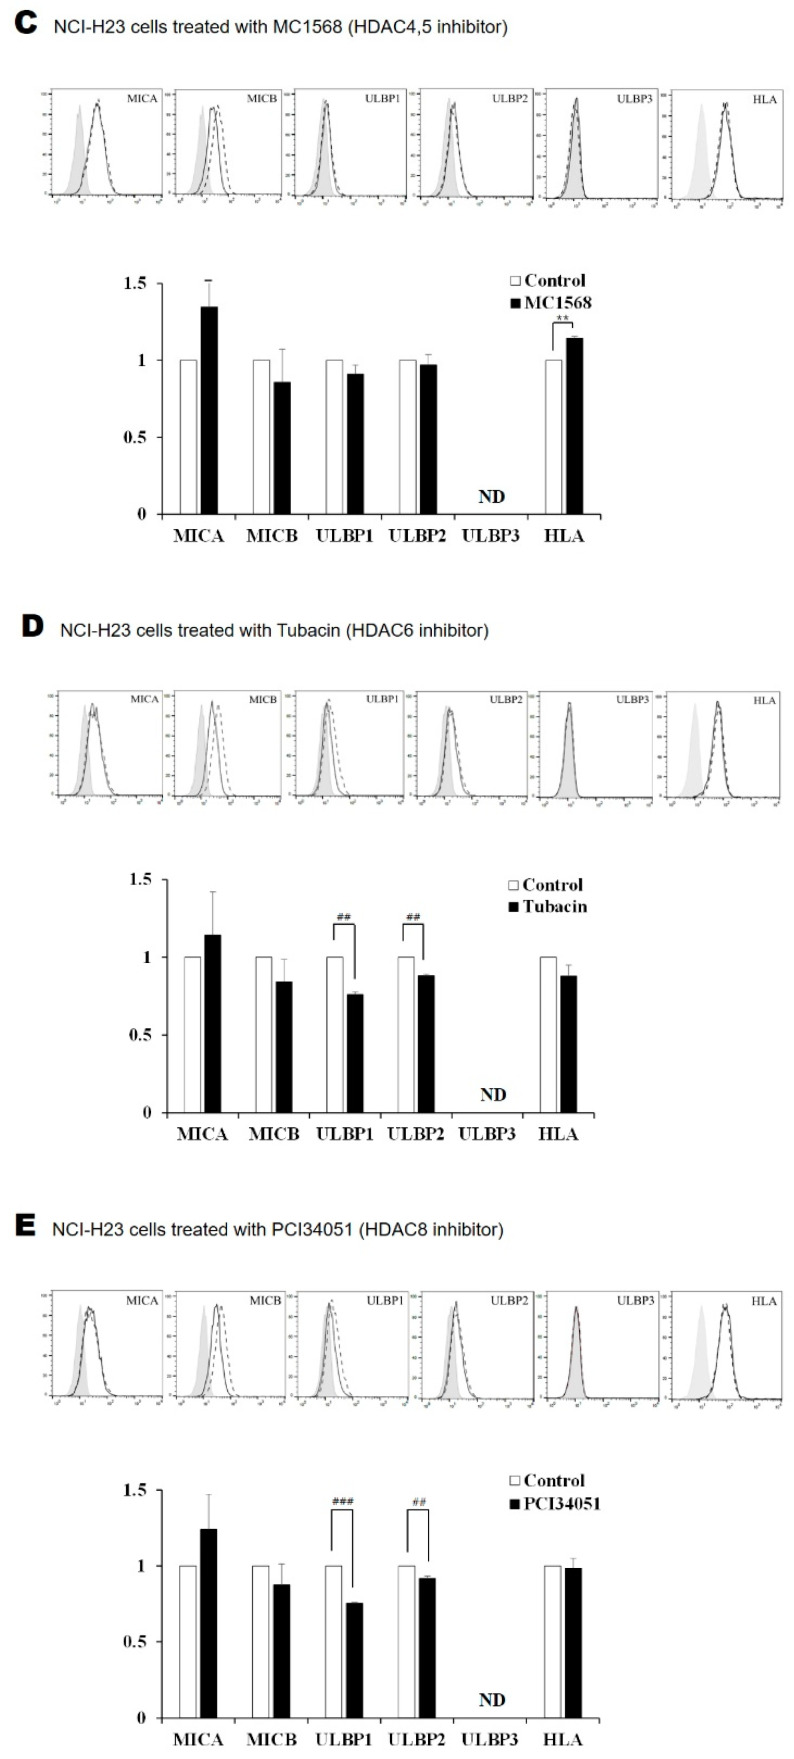
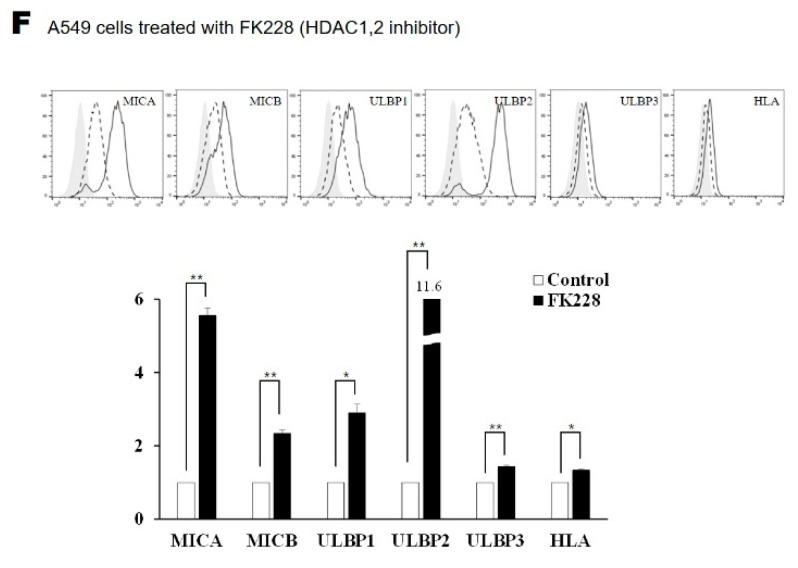
Figure 2.
Treatment with HDAC inhibitors alters the surface expression of NKG2D ligands. Histograms show the surface expression of NKG2D ligands in NCI-H23 lung cancer cells that were treated for 24 h with 100 nM of (A) FK228, (B) RGFP966, (C) MC1568, (D) Tubacin, and (E) PCI34051. (F) The A549 cells were treated with 100 nM FK228 for 24 h. Relative expression ratios were calculated by comparing the MFI of FK228-treated cells with control cells. Solid gray, dotted, and black lines represent the isotype control, media-treated control, and HDAC inhibitor-treated samples, respectively. * represents a statistically significant increase and # represents a statistically significant decrease. p-values less than 0.05, 0.01, and 0.001 are marked as *, **/##, and ### symbols, respectively. ND means not detected.


