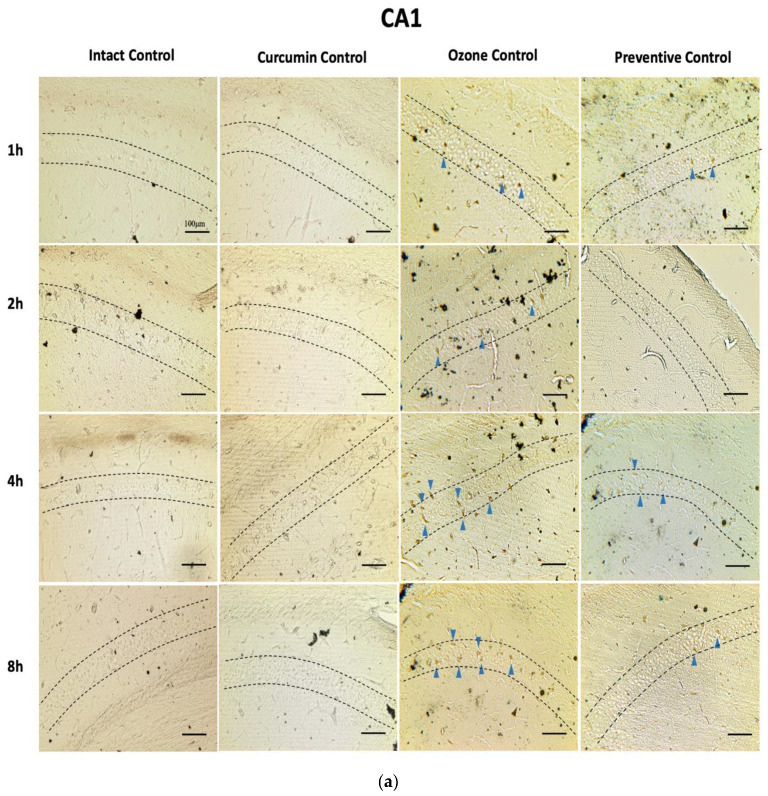
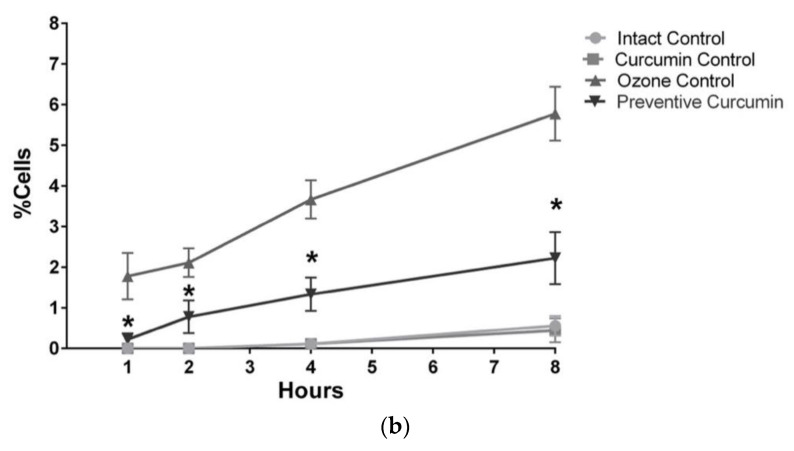
Figure 1.
Effect of CUR against hippocampal neurodegeneration after short-term O3 exposure (Table S1). CA1 region was evaluated by a modified silver technique (de Olmos stain). (a) This panel shows representative images of tissue sections at different O3 exposure times in experimental groups (n = 5), showing positive cells (dark brown), indicated with blue arrowheads, dashed lines indicate the CA1 area. (b) The graph illustrates the comparison of the degenerative cell percentage at each exposure time in experimental groups; results are expressed as mean values ± SEM, and the asterisk always indicates a statistical difference between the preventive curcumin and the ozone control groups (p < 0.05). Data of intact control and curcumin control groups are overlapped in the two lines at the bottom.


