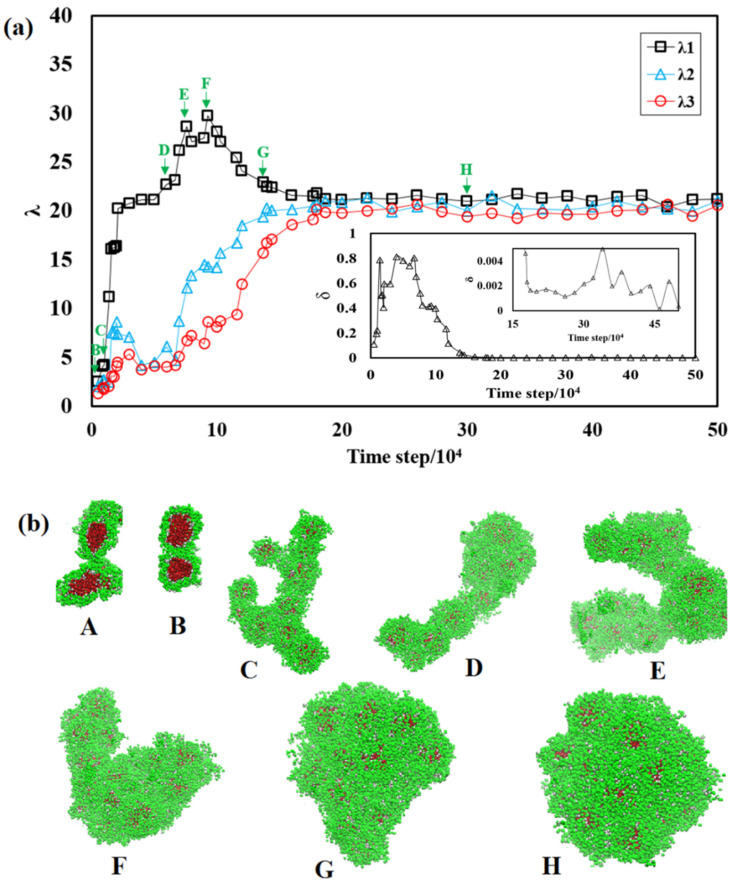
Figure 3.
(a) The time evolution of λl, λ2, and λ3 of the largest aggregates at different simulation steps. The embedded figure is the corresponding asphericity, δ. (b) The corresponding morphologies of the largest aggregates. Solvent beads are omitted for clarity. The color codes are the same as those in Figure 1.

