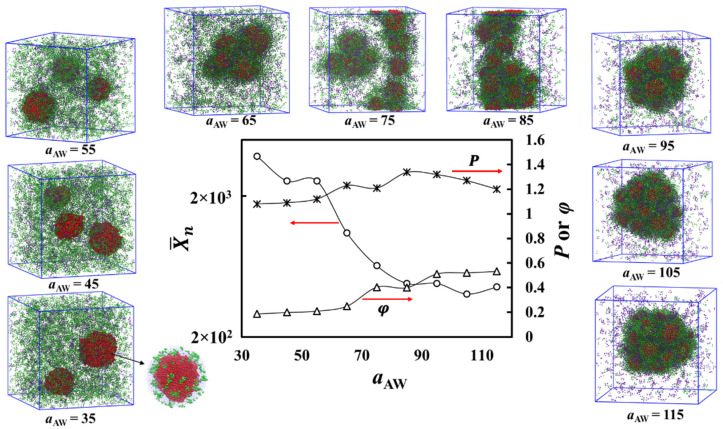
Figure 4.
Simulation snapshots and analysis of the aggregate structural changes when aAW is varied in the system containing A19 (4%), A1-b-S6 (13%), and S6 (3%). Solvent beads are omitted for clarity. The color scheme is the same as that of Figure 1. The data graphs show mean aggregation number , polydispersity index (P) of the solvophobic cores, and the order parameter (φ) of the overall aggregate versus the more solvophobic polymer–solvent interaction parameter aAW. Error bars are smaller than the symbol size. The scatter in the data is due to finite size effects in the simulations.

