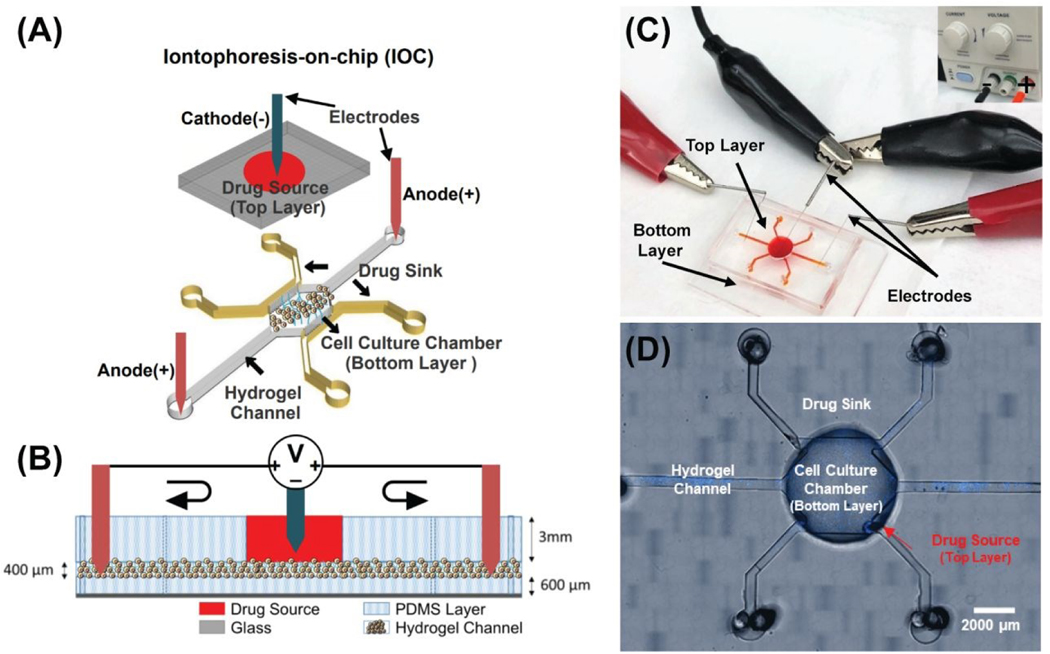
Figure 2. Iontophoresis-on-chip (IOC) for quantifying iontophoretic delivery of chemotherapeutic drugs in vitro.
(A) Microfluidic experiment setup, three-dimensional top view of microfluidic device, negative electrode inserted in drug source well and positive electrodes added to the bottom tumor region layer. (B) Side view of the open microfluidic device and the electric field circuit. (C) Image of experimental setup and application of a DC electric field for drug delivery from the top layer into the tumor region in the bottom layer. (D) Microfluidic device designed to measure iontophoresis drug delivery. Bottom layer includes: 1) Drug sink. 2) Cell culture chamber for MDA-MB-231 cells (blue, Hoechst stain). 3) Electrophoresis channels for the delivery of drugs from the cell culture chamber to the side channels through electrophoresis and diffusion. Top layer is the drug source.

