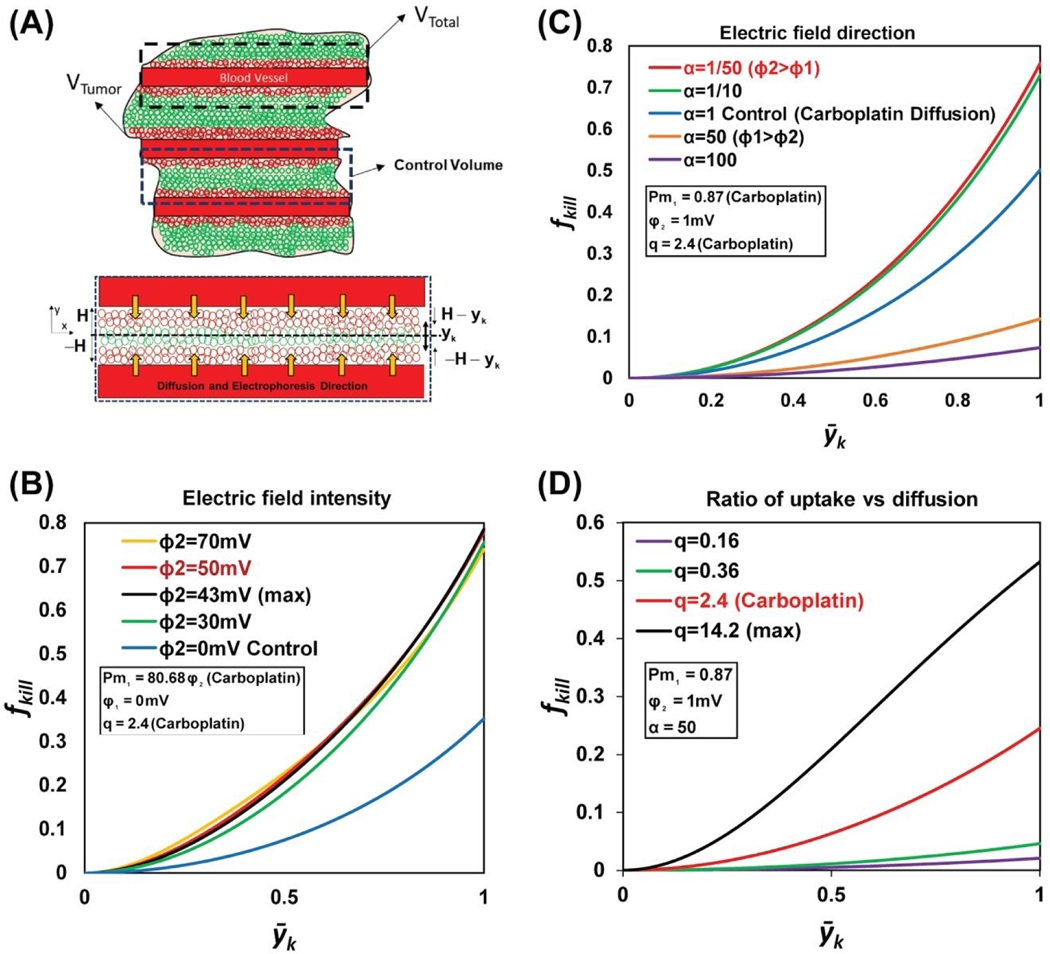
Figure 3. Mathematical model sensitivity analysis of the fraction of tumor cells killed model.
(A) The schematic illustrates the volume of the analytical domain under study (VTotal), which is the sum of the volume of a single blood vessel and the surrounding tumor mass (VTumor). VTumor includes both the live and dead tumor cells, represented by the green and red circles, respectively. Vcontrol depicts the volume between two consecutive blood vessels and is used as the control volume for the mathematical model, with idealized system boundaries (𝐻, ― 𝐻, ― 𝑦𝑘, ― 𝐻 ― 𝑦𝑘). (B) The graph shows the variation in the fraction of tumor cells killed (fkill) over a dimensionless kill distance yk, for different values of Pm1 and electric field intensities. The sensitivity analysis predicted 43 mV as the optimal electrical voltage required to maximize the fraction of tumor cells killed (0.79). (C) The graph shows the variation in the fraction of tumor cells killed (fkill) over a dimensionless kill distance, yk, for different values of 𝛼 (which is the ratio of electric potential in the drug source (𝜑1) to the electric potential in the tumor (𝜑2)). When 𝜑2 is 50 times more than 𝜑1, the diffusion and electrophoretic movement of the charged drug molecules are in the same direction, and the fraction of tumor cells killed is at its maximum (0.75). (D) The graph shows the variation in the fraction of tumor cells killed (fkill) over a dimensionless kill distance, yk, for different values of q (the ratio of the drug uptake rate to the drug diffusion). For carboplatin q=2.4, where the fraction of cells killed is 0.25.

