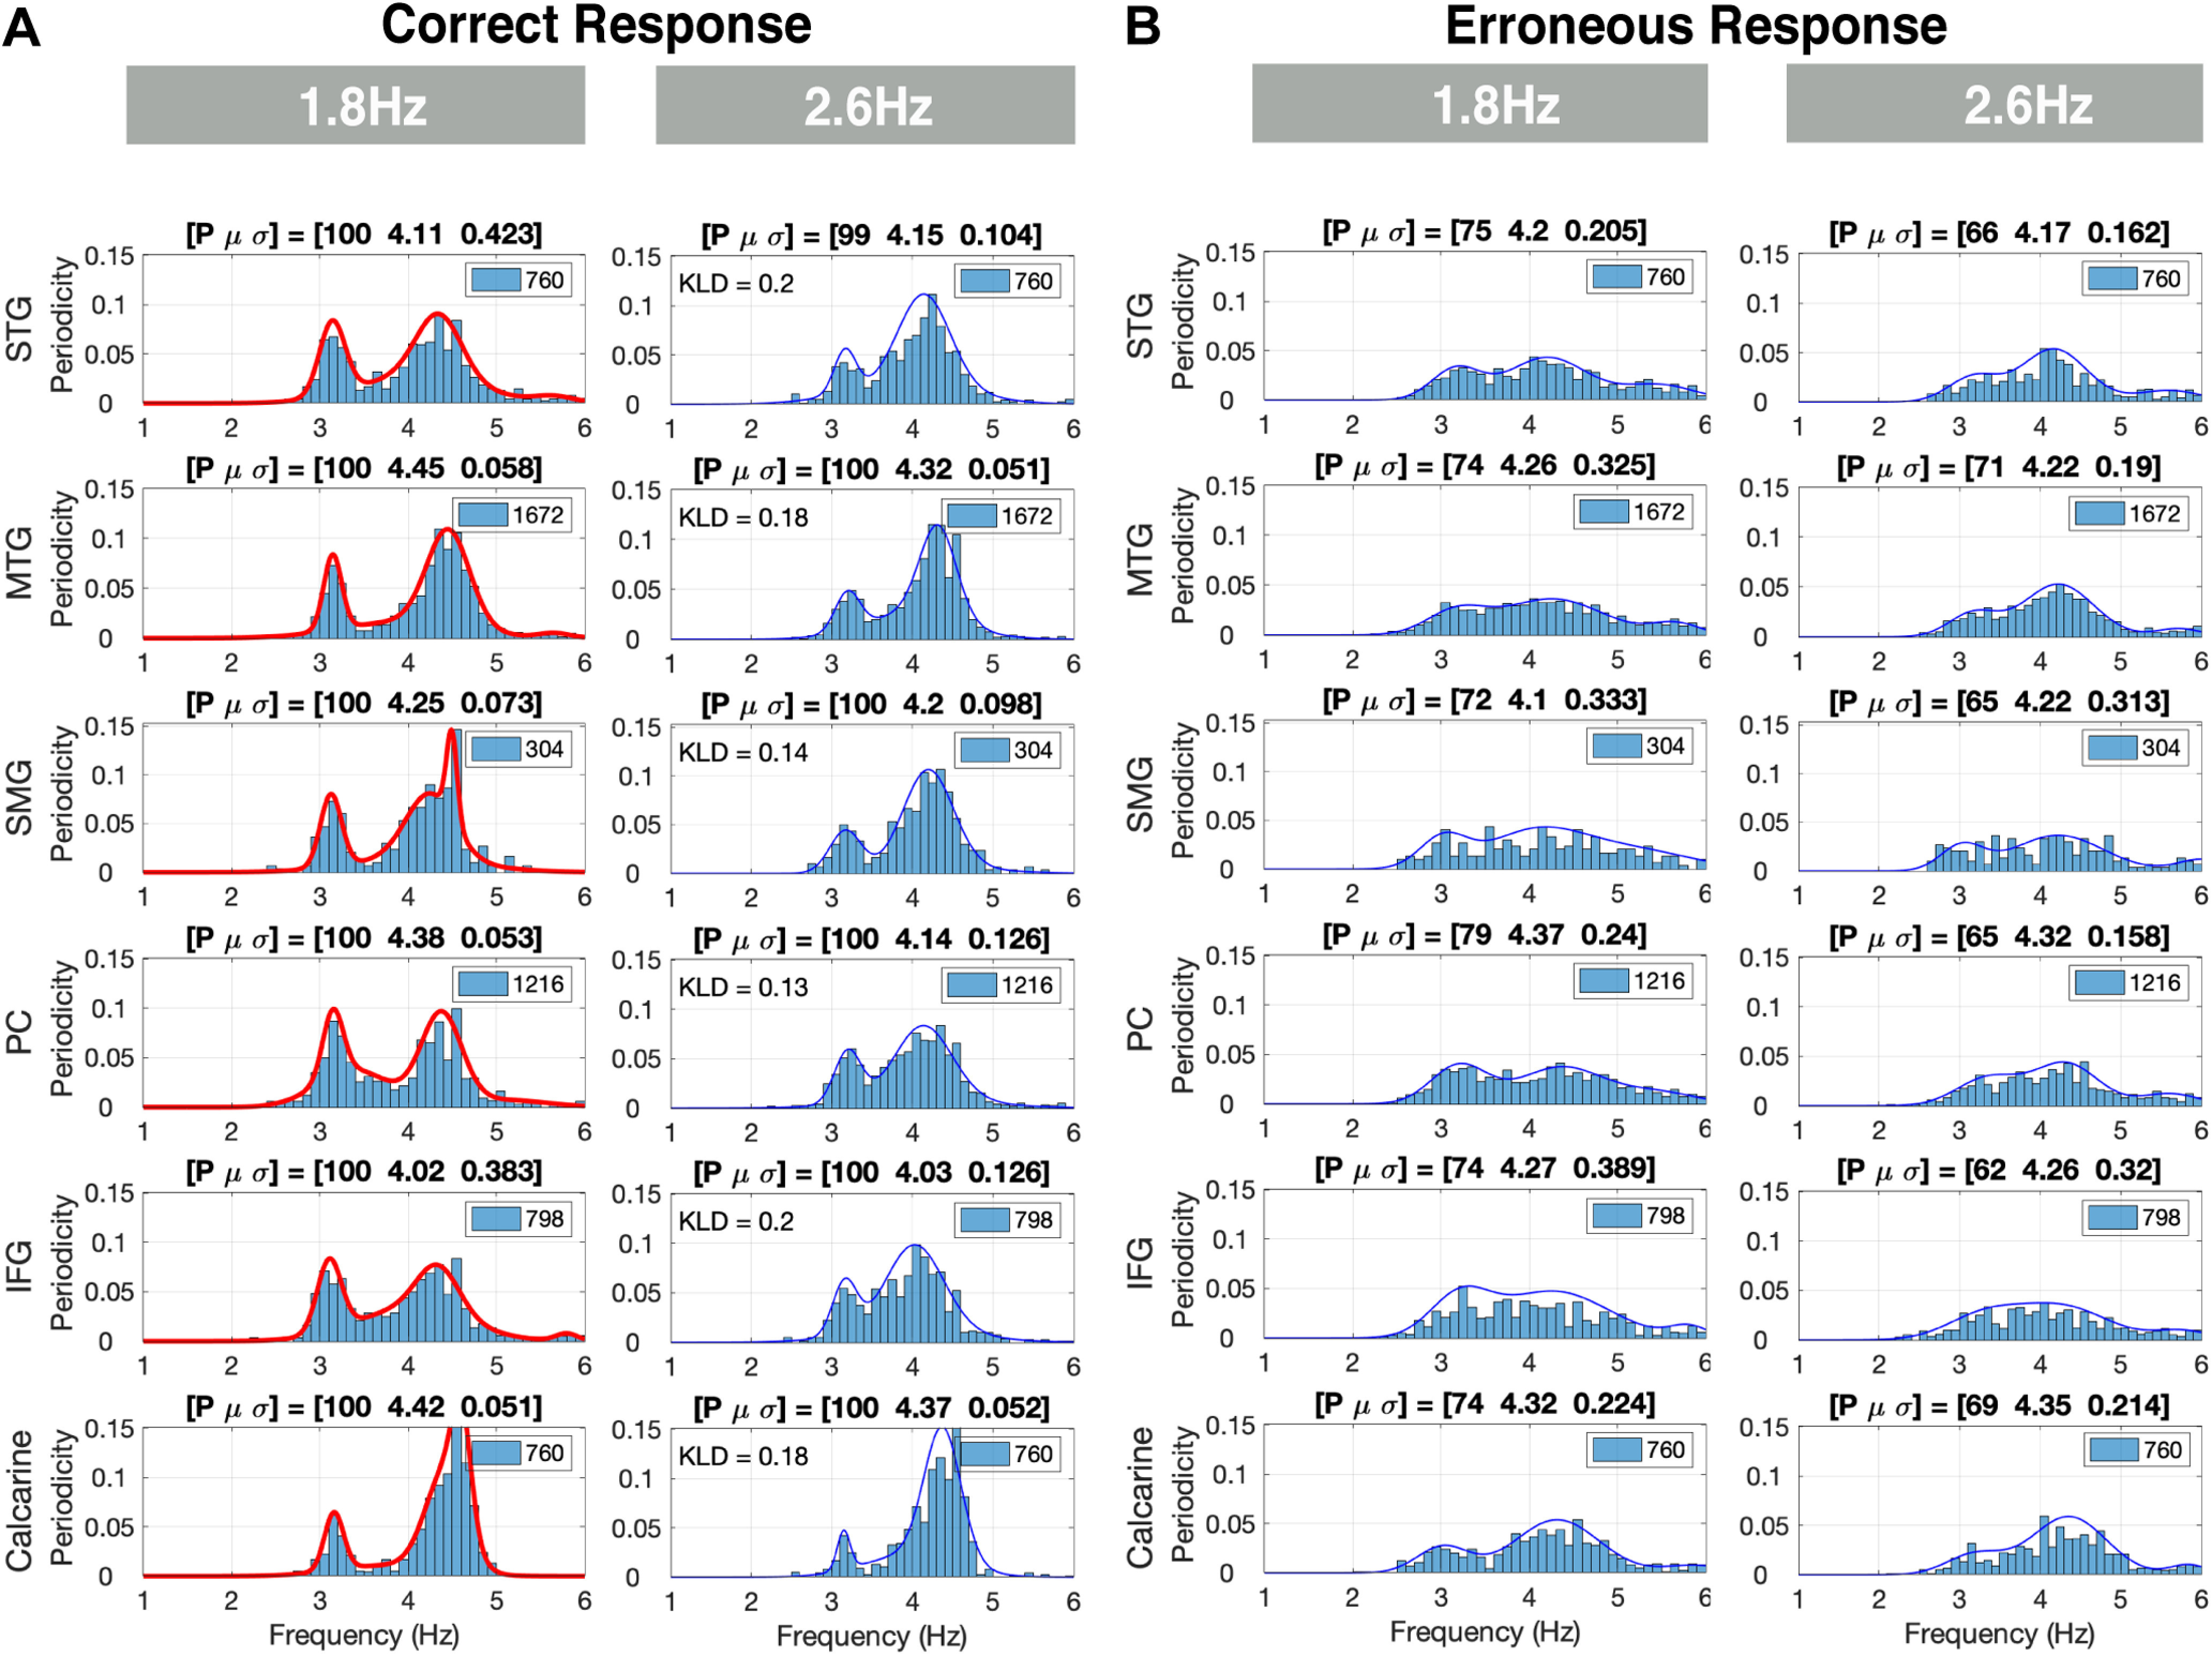
Figure 7.

θ Periodicities for correct and erroneous responses in the left hemisphere. A, Periodicities for correct responses: strong θ periodicities were present in all regions of interest (ROIs) and for all chunking conditions. Such elicited neural response patterns reflect the single digit presentation rate. The histograms are scaled to L × N (see inset). The periodicity density functions (PDFs) are similar in shape across conditions, as is quantified by the KLD values comparing the PDFs in the 1.8-Hz condition with respect to the 2.6-Hz condition. B, Periodicities for erroneous responses: a weaker more dispersed presence of θ periodicities is recorded for all conditions (lower p value and wider σ).
