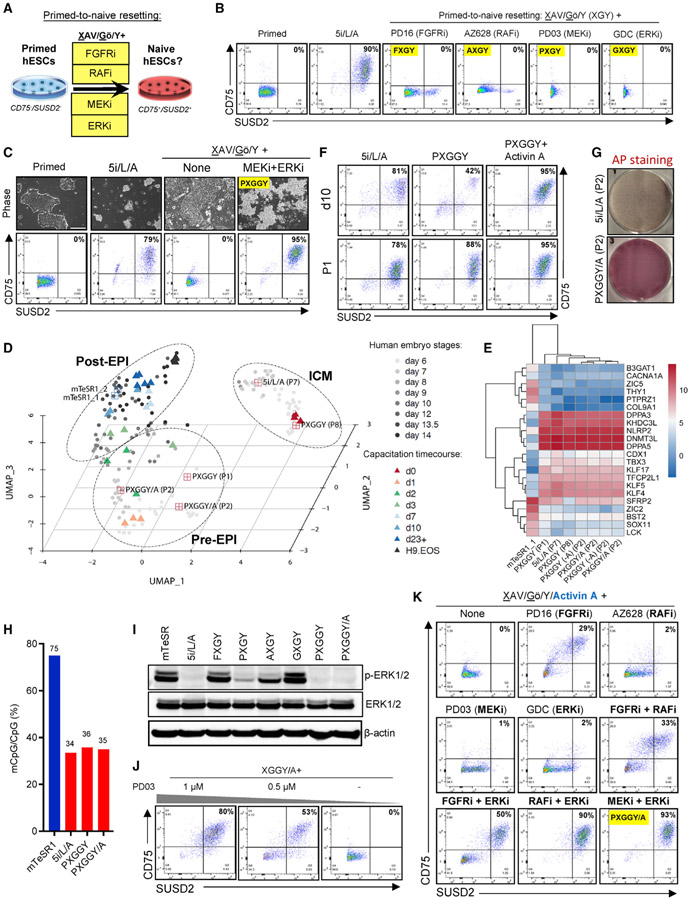
Figure 5. Examining the signaling requirements for primed-to-naive resetting.
(A) Experimental scheme for evaluating the efficacy of alternative naive maintenance media to induce naive pluripotency in primed hESCs. Successful induction of naive pluripotency was assessed by flow cytometry for the naive-specific cell-surface markers CD75 and SUSD2 at the end of P1.
(B) Flow-cytometry analyses for naive-specific cell-surface markers CD75 and SUSD2 at the end of P1 of primed-to-naive conversion using H9 hESCs in 5i/L/A and four alternative naive maintenance conditions. Data are representative of two biological replicates.
(C) Phase-contrast images (top) and flow-cytometry analysis for naive-specific cell-surface markers CD75 and SUSD2 (bottom) in H9 primed hESCs upon treatment with XAV939, Gö6983, and Y-27632 (XAV/Gö/Y) together with the MEK inhibitor PD0325901 and the ERK inhibitor GDC-0994 (PXGGY) at the end of P1. Data are representative of two biological replicates. The scale bar depicts 250 μm.
(D) UMAP dimension reduction analysis of single cell RNA-seq data representing the ICM, Pre-EPI, and Post-EPI from 3D-cultured human embryos (Xiang et al., 2020) compared to naive hESCs that were derived in PXGGY at P1 and P8 or PXGGY+activin A(PXGGY/A) at P2. Expression data were compared to H9 mTeSR1 and 5i/L/A samples previously analyzed in Figure 3. Clusters are drawn to indicate in vivo samples as shown in (Xiang et al., 2020). A time-course RNA-seq analysis of naive hESCs undergoing capacitation into a formative pluripotent state (Rostovskaya et al., 2019) was also integrated into this UMAP.
(E) Expression heatmap of selected naive and primed-specific markers in H9 hESCs for the primed-to-naive conversion conditions described in Figure 5C and Figure 5F. Naive hESCs derived in PXGGY were examined at the end of P1 and P8. We also examined naive hESCs that were derived in PXGGY/A and subsequently maintained in the presence or absence of activin A for two passages (PXGGY-A) in two biological replicates each. Expression data were compared to H9 mTeSR1 and 5i/L/A samples previously analyzed in Figure 3.
(F) Flow-cytometry analysis using antibodies for the naive-specific cell-surface markers CD75 and SUSD2 in H9 primed hESCs upon treatment with 5i/L/A, PXGGY, and PXGGY/A at day 10 (top) and at the end of P1 (bottom) of primed-to-naive resetting. Data are representative of two biological replicates.
(G) Alkaline phosphatase (AP) staining of H9 hESCs after two passages of primed-to-naive conversion in 5i/L/A and PXGGY/A. Data are representative of two biological replicates.
(H) Genome-wide CpG DNA methylation level of H9-naive hESCs that were converted in 5i/L/A or PXGGY/A at P5. We also examined naive hESCs that were derived in PXGGY/A and maintained for four additional passages in the absence of activin A. Data were compared to the H9 mTeSR1 and 5i/L/A samples previously analyzed in Figure 4I.
(I) Western blot analysis for p-ERK1/2, total ERK1/2, and β-actin (loading control) protein levels in H9 primed hESCs treated with indicated media.
(J) Flow-cytometry analysis using antibodies for the naive-specific cell-surface markers CD75 and SUSD2 to assess the effect of MEK inhibitor PD0325901 titration during primed-to-naive resetting of H9 primed hESCs in PXGGY/A medium at the end of P1.
(K) Flow-cytometry analysis using antibodies for the naive-specific cell-surface markers CD75 and SUSD2 during primed-to-naive resetting of H9 primed hESCs by various combinations of FGF pathway inhibitors at the end of P1. Data are representative of two biological replicates.

