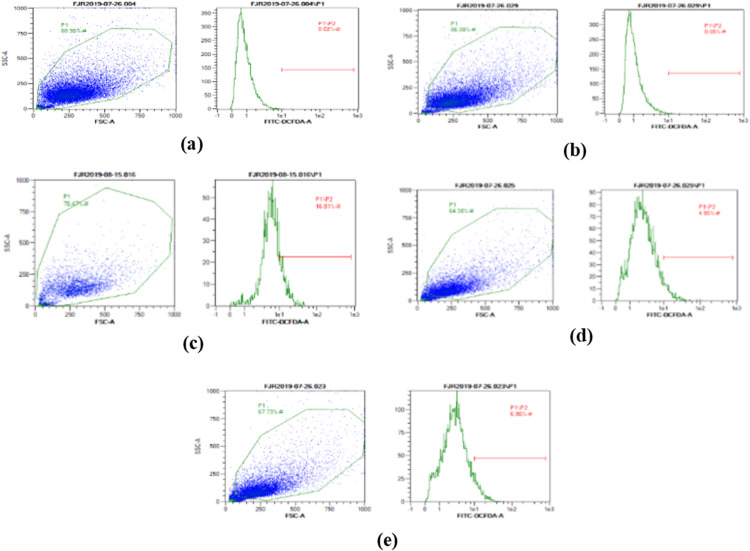
Figure 2. The representative of dot blots of various concentration CA on UV-induced fibroblast cell toward ROS level by flow cytometry.
(A) BJ cells (negative control); 0.02%, (B) BJ cells + DMSO 1% (vehicle control): 0.05%, (C) BJ cells + UV (positive control): 16.01%, (D): UV-induced BJ cells + CA 6.25 µg/ml: 4.95%, (E): UV-induced BJ cells + CA 25 µg/ml: 6.86%.

