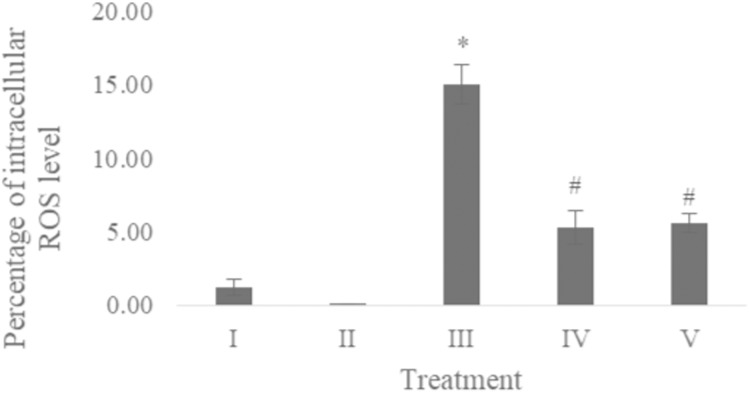
Figure 3. Effect CA towards ROS level on UV-induced fibroblast cells.
(I) BJ cells (negative control), (II) BJ cells + DMSO 1% (vehicle control), (III) UV-induced BJ cells (positive control), (IV) UV-induced BJ cells + CA 6.25 µg/ml, (V) UV-induced BJ cells + CA 25 µg/ml. *Data is presented as mean ± standard deviation. A single asterisk symbol (*) marks statistical difference compared to negative control group at 0.05 significance level, a single hashtag (#) marks statistical difference compared positive control at 0.05 significance level based on Tukey HSD post hoc test.

