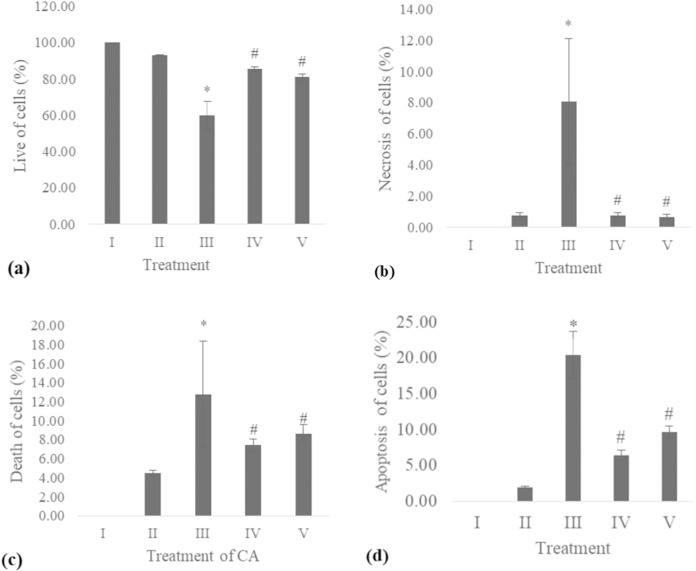
Figure 5. Effect CA towards apoptosis cells on UV-induced fibroblast cells.
(A) live of cells, (B) necrosis of cells, (C) death of cells (late apoptosis of cells), (D) apoptosis of cells (early apoptosis of cells) (I) BJ cells (negative control), (II) BJ cells + DMSO 1% (vehicle control), (III) BJ cells + UV (positive control), (IV) UV-induced BJ cells + CA cells + CA 6.25 µg/ml, (V) UV-induced BJ cells + CA 25 µg/ml. *Data is presented as mean ± standard deviation. A single asterisk symbol (*) marks statistical difference compared to negative control group at 0.05 significance level, a single hashtag (#) marks statistical difference compared positive control at 0.05 significance level based on Tukey HSD post hoc test.

