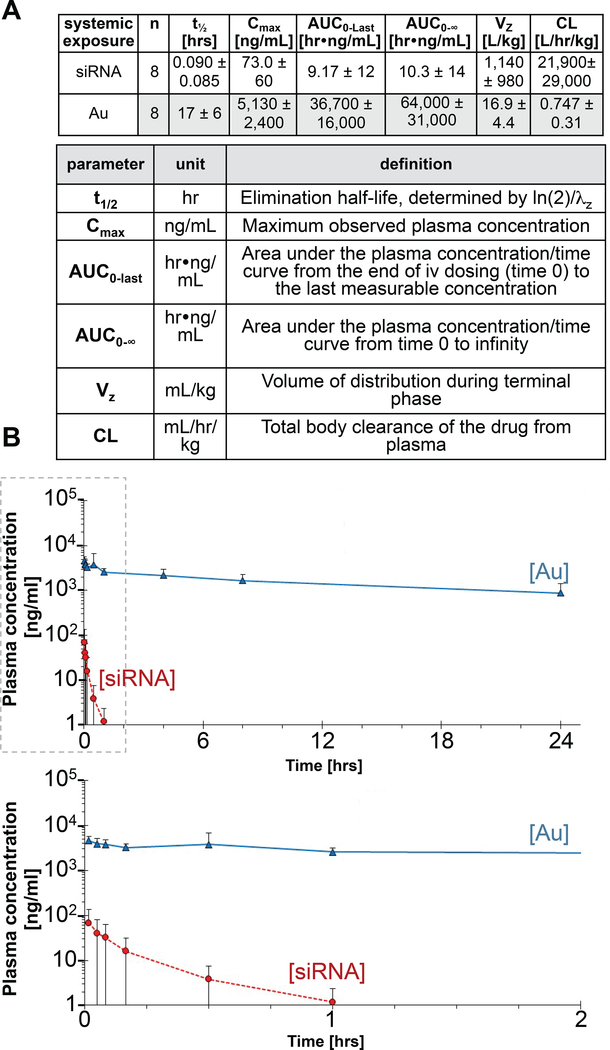
Fig. 2. Average plasma concentration-time profiles of siRNA and Au following intravenous infusion in recurrent GBM patients.
(A) Key pharmacokinetic parameters of siRNA and Au in patient plasma. Standard deviations are indicated in brackets. (B) Plot of average plasma concentration time profiles of siRNA and Au following an IV Infusion with NU-0129; lower panel shows graph truncated at the 2 hrs time point post infusion. Data points are shown ± standard deviations. Blood was drawn at 0, 1, 3, 5, 10 min, 0.5, 1, 4, 8 and 24 hrs post NU-0129 infusion.

