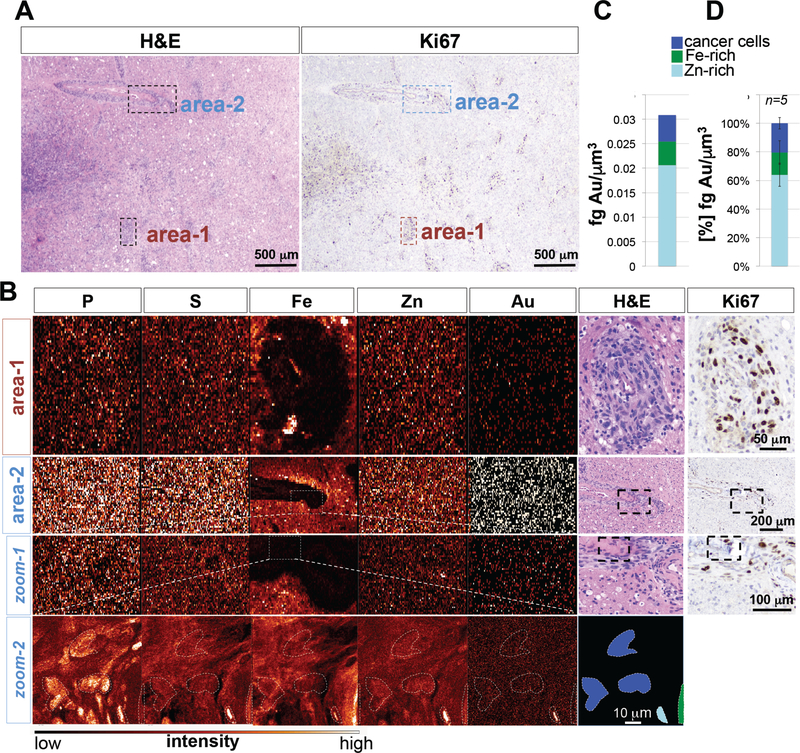
Fig. 3. XFM elemental maps of recurrent GBM tumor (X-ray beam spot 0.3 micron).
(A) Overview H&E and Ki67 staining of patient 106 tumor. Indicated are 2 perivascular tumor regions. (B) Phosphorus (P), sulfur (S), iron (Fe), zinc (Zn) and gold (Au) elemental maps of GBM tumor sample 106. Magnified areas from large step size scans are boxed. (C) Quantification of Au content in Zn-rich areas, Ki67-positive glioma cells, and Fe-rich areas. Color bar indicates pixel concentrations for each element ranging from black (no signal) to white (highest signal for a given element). (D) Cumulative quantification of Au distribution in the different cell populations across different sections and patient tumors. A total of 5 sections were analyzed. Shown is the median ± standard deviation.

