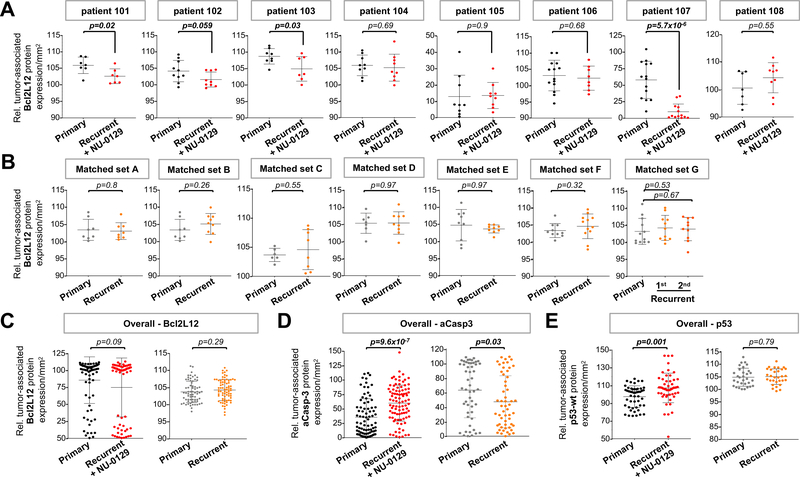
Fig. 6. Protein expression of Bcl2L12, active caspase-3 and wild-type 53 in matched newly diagnosed and NU-0129-treated recurrent GBM.
(A-B) Histoquest quantification of IHC staining for Bcl2L12 in matched primary and NU-0129-treated recurrent GBM tumors, and in trial unrelated matched primary and recurrent GBM tumors. A minimum of 8 ROIs were selected per tumor samples. Shown is the mean ± standard deviations. (C-E) Histoquest quantification of overall IHC staining intensities for Bcl2L12, and the Bcl2L12 downstream effectors active caspase-3 and wild-type p53 (8–13 ROIs selected). Shown is the mean ± standard deviations. For all analyses, ROIs were randomly chosen. Cells within ROIs have above-background signal for IHC markers (mean intensity >60 for Bcl2L12; >15 for active caspase-3; >50 for p53). Tumor cells were identified based on the presence of larger nuclei with nuclear areas >50 μm2 and mean nuclear staining intensity of > 67. Shown is the fraction of marker positive tumor cells per total number of tumor cells per mm2. Outliers were identified by applying the interquartile range rule. p values were calculated using Student’s t-test. Patient tumors with significant differences in IHC marker expression level (p<0.05) are highlighted in bold.

