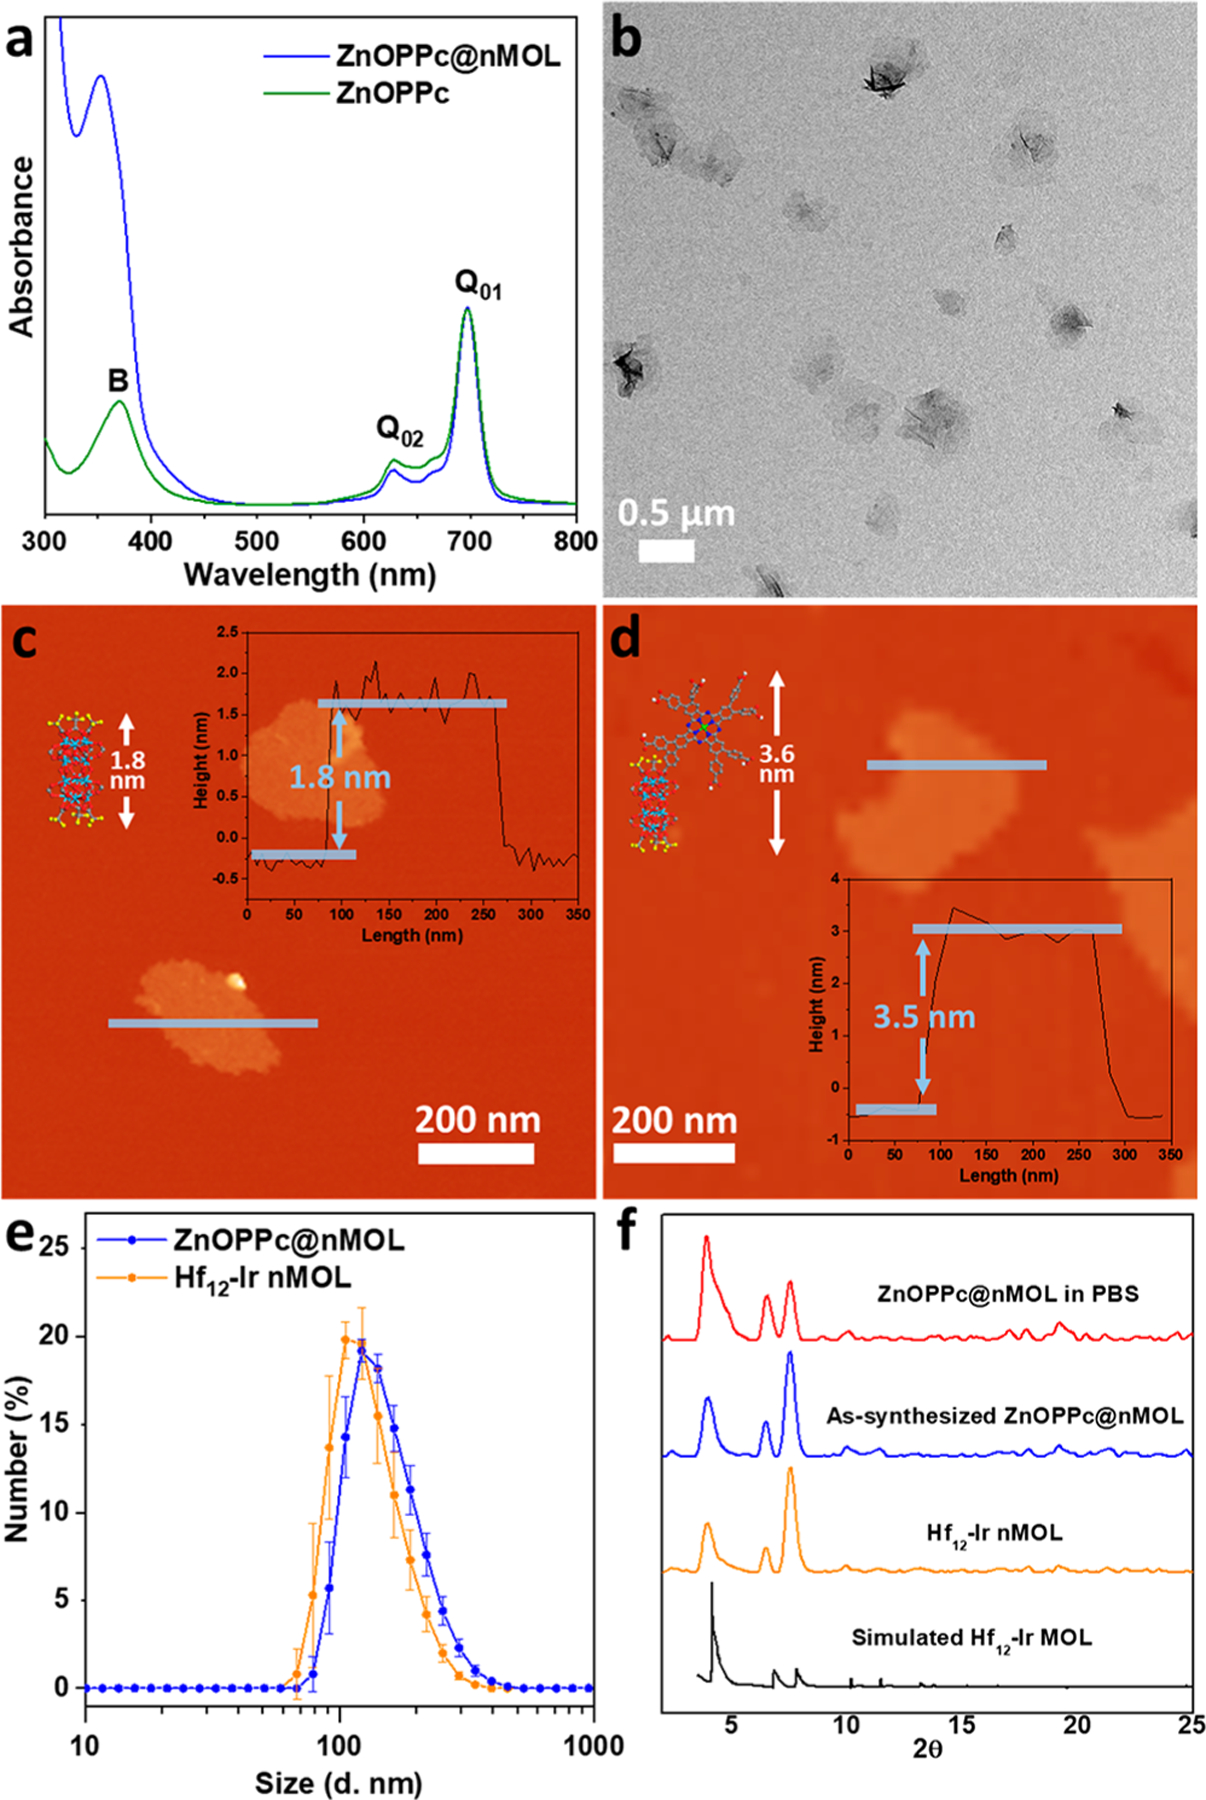
Figure 2.

(a) UV–visible absorption spectra of ZnOPPc and ZnOPPc@nMOL in DMSO showing characteristic B- and Q-band peaks. (b) TEM image of ZnOPPc@nMOL. AFM topography, height profile (inset), and modeled heights of (c) Hf12-Ir nMOL and (d) ZnOPPc@nMOL. (e) Number-averaged diameters in ethanol and (f) PXRD patterns of Hf12-Ir nMOL, as-synthesized ZnOPPc@nMOL, and ZnOPPc@nMOL after soaking in PBS for 16 h, along with the simulated pattern for the Hf12 MOL.
